Impact of Variability on Mean Response in Non-linear Contexts: Insights from Skewness Analysis
This research explores the variability and mean response in non-linear contexts, particularly focusing on how curvature affects responses to extreme environmental factors. It examines observational evidence through flux data and remote sensing, highlighting the relationship between precipitation extremes and skewness in Gross Primary Production (GPP). The study reveals crucial insights into the impacts of extreme precipitation on ecosystem dynamics, demonstrating shifts in skewness from negative to positive throughout the year, emphasizing the importance of seasonality in ecological responses.

Impact of Variability on Mean Response in Non-linear Contexts: Insights from Skewness Analysis
E N D
Presentation Transcript
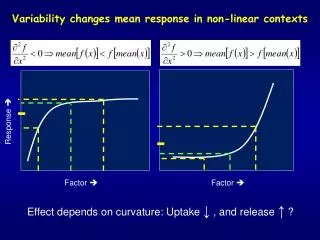
Variability changes mean response in non-linear contexts Response Factor Factor Effect depends on curvature: Uptake ↓ , and release ↑ ?
Forcing and response function make the extreme Forcing x Transferfunction f Response variable y Pos. skewed ‚slow-out rapid-in‘? Neg skewed ‚slow-in fast-out‘
Impact of more extreme precip depends on ‚normal‘ state Knapp et al. 2008, BioScience
Observational evidence by fusing flux data and remote sensing fAPAR mediterraneanneg skewed Pos skewed Neg skewed (red and yellow) ‘ new FAPAR metric as GPP proxy, cf. Jung et al. 2008, GCB
Skewness of 100-yr LPJ NEP May Pos skewed Neg skewed Jul Shift from neg skewness in May to pos skewness in Jul seasonality matters !