Integrated Strategic Development Framework
The Integrated Strategic Development Framework (ISDF) for Knysna, established in October 2013, presents an analysis of civil services focusing on water, roads, and transportation infrastructure. The framework outlines the current status of water sourcing, treatment capacity, and future demand projections for Knysna and surrounding areas. Critical issues like insufficient storage and distribution capacity are highlighted, suggesting urgent upgrades to ensure sustainable water supply and support for future growth and development.


Integrated Strategic Development Framework
E N D
Presentation Transcript
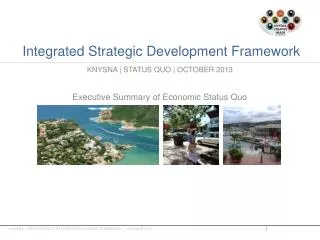
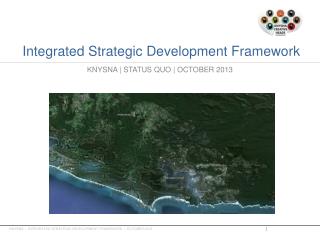
Integrated Strategic Development Framework KNYSNA | STATUS QUO | OCTOBER 2013 CIVIL SERVICES, ROADS AND TRANSPORTATION KNYSNA | INTEGRATED STRATEGIC DEVELOPMENT FRAMEWORK | OCTOBER 2013
Integrated Strategic Development Framework KNYSNA | STATUS QUO | OCTOBER 2013 CIVIL SERVICES CONTENTS • WATER INFRASTRUCTURE • SEWER INFRASTRUCTURE • ROAD INFRASTRUCTURE • STORMWATER INFRASTRUCTURE • TRANSPORTATION • SOLID WASTE KNYSNA | INTEGRATED STRATEGIC DEVELOPMENT FRAMEWORK | OCTOBER 2013
WATER INFRASTRUCTURE KNYSNA TOWN • Water Sources Knysna River(65%), Gouna River(17%) , Bigai Springs, Glebe Dam(10%), Akkerkloof Dam, Boreholes • Treatment Infrastructure Knysna Water Treatment Works and Reverse Osmosis Plant • Treatment Capacity 23.25 Ml/day • Current Demand Avg/Peak(Dec) 10/15 Ml/day 3650 Ml/a • Future Demand Avg/Peak(Dec) 15/23 Ml/day 5475 Ml/a • Storage 32.515 Ml in 41 Reservoirs/Tanks • The assured yield (98%) of the main raw water sources is estimated at 4489 Ml/a. • The permitted abstraction (Knysna/Gouna Rivers) are 4740 Ml/annum • The graphical information of the future treated water demand indicate that the demand will exceed the assured yield in approximately 2017-2018, based on a 3% growth. • Water losses are estimated at 14.4%, 4% down from the previous year. KNYSNA | INTEGRATED STRATEGIC DEVELOPMENT FRAMEWORK | OCTOBER 2013
WATER INFRASTRUCTURE PROBLEMS IDENTIFIED • The above dictates that future water sources will be largely dependant on the augmentation of the existing sources (dams) and possibly desalination plants. • The bulk distribution and storage system is adequate for the existing status quo, but do not have the capacity to deal with the full occupation of existing developments and future developments. • Bulk supply routes to Old Place Lower, Dam se Bos, Thessen Hill and Leisure Isle have insufficient capacity. • Insufficient storage zones identified was Eastford Lower, Concordia East, Heuwelkruin Lower, Thessen Hill, Bongani, Dam se Bos, Old Place Low Level, Corlet Drive and The Heads. • The Akkerkloof Dam only holds enough water to supply the town with water for 30 days. The recommended minimum is 60 days KNYSNA | INTEGRATED STRATEGIC DEVELOPMENT FRAMEWORK | OCTOBER 2013
KNYSNA-BELVIDERE-BRENTON WATER INFRASTRUCTURE KNYSNA | INTEGRATED STRATEGIC DEVELOPMENT FRAMEWORK | OCTOBER 2013
WATER INFRASTRUCTURE SEDGEFIELD • Water Sources Karatara River(57%), Desalination Plant(42%) , Boreholes • Treatment Infrastructure Sedgefield Water Treatment Works Desalination Plant • Treatment Capacity 4.0 Ml/day 1.5 Ml/d • Current Demand Avg/Peak(Dec) 2/3 Ml/day 730/1095 Ml/a • Future Demand Avg/Peak(Dec) 4.26 Ml/day 1555Ml/a • Storage 4.0 Ml in 3 Reservoirs • The permitted abstraction (Karatara River) are 740 Ml/a, • The assured yield of river is calculated at 340 Ml/a. PROBLEMS IDENTIFIED • The figures indicate that Sedgefield have a water supply problem and cannot cope with any major development at present or growth. • The bulk distribution and storage system is adequate for the existing status quo, but do not have the capacity to deal with the full occupation of existing developments and future developments. • The main town zone has insufficient storage. KNYSNA | INTEGRATED STRATEGIC DEVELOPMENT FRAMEWORK | OCTOBER 2013
SEDGEFIELD WATER INFRASTRUCTURE KNYSNA | INTEGRATED STRATEGIC DEVELOPMENT FRAMEWORK | OCTOBER 2013
WATER INFRASTRUCTURE KARATARA • Water Sources Karatara River • Treatment Infrastructure Karatara Water Treatment Works • Treatment Capacity 0.79 Ml/day • Current Demand Avg/Peak(Dec) 0.2 Ml/day max 73 Ml/a • Future Demand Avg/Peak(Dec) 0.323 Ml/day 117.9 Ml/a • Storage 0.8 Ml in 2 Reservoirs • The current abstraction from the Karatara River is 81Ml/a. • The Treatment Works and storage provide adequately for the demand. • Water is pumped out of the Karatara River and stored in an off-channel dam. • The assured yield of the Karatara River is sufficient to supply the village onwards but may be affected by future developments in the area. PROBLEMS IDENTIFIED • The 5km bulk supply line is in a poor condition and requires complete replacement. KNYSNA | INTEGRATED STRATEGIC DEVELOPMENT FRAMEWORK | OCTOBER 2013
WATER INFRASTRUCTUREKARATARA KNYSNA | INTEGRATED STRATEGIC DEVELOPMENT FRAMEWORK | OCTOBER 2013
WATER INFRASTRUCTURE BUFFALO BAY • Water Sources Goukamma River • Treatment Infrastructure Buffalo Bay Water Treatment Works • Treatment Capacity 0.95 Ml/day • Current Demand Avg/Peak(Dec) 0.1/0.5 Ml/day 36.5 Ml/a • Storage 1.5 Ml in 4 Reservoirs • The current abstraction from the Karatara River is 41 Ml/a. • The Treatment Works and storage provide adequately for the normal demand but cannot cope with the seasonal peak. • In lieu of the fact that the village is hemmed in by nature reserves, no major developments are foreseen, hence no future demands are indicated. KNYSNA | INTEGRATED STRATEGIC DEVELOPMENT FRAMEWORK | OCTOBER 2013
BUFFALOBAY WATER INFRASTRUCTURE KNYSNA | INTEGRATED STRATEGIC DEVELOPMENT FRAMEWORK | OCTOBER 2013
WATER INFRASTRUCTURE RHEENENDAL • Water Sources Homtini River • Treatment Infrastructure Keurhoek Water Treatment Works • Treatment Capacity 0.61 Ml/day • Current Demand Avg/Peak(Dec) 0.2/0.28 Ml/day max 73 Ml/a • Future Demand Avg/Peak(Dec) 0.41 Ml/day 149.65 Ml/a • Storage 0.4 Ml in 1 Reservoir and 1 Tower • The assured yield of the Homtini River is sufficient for the village. • No storage facility for raw water is in place and off-channel storage and associated increase in pumping capacity be provided to ensure the security of the supply for further development. PROBLEMS IDENTIFIED • The bulk distribution and storage system is adequate for the existing status quo, but does not allow for growth and as such raw water sources will need to be investigated. • The entire town has insufficient reservoir storage. KNYSNA | INTEGRATED STRATEGIC DEVELOPMENT FRAMEWORK | OCTOBER 2013
RHEENENDAL WATER INFRASTRUCTURE KNYSNA | INTEGRATED STRATEGIC DEVELOPMENT FRAMEWORK | OCTOBER 2013
WATER INFRASTRUCTURE BRENTON • Water Sources Boreholes and Knysna WTW • Treatment Infrastructure Nil • Treatment Capacity Nil • Current Demand Avg/Peak(Dec) 0.4/0.6 Ml/day • Future Demand Avg/Peak(Dec) 0.6/0.9 Ml/day • Storage 3.17 Ml in 6 Reservoirs • The current water demand is 146 Ml/annum. • Water is obtained from boreholes, with the Knysna WTW as supplementary source when required. PROBLEMS IDENTIFIED • It must be noted that any substantial developments that require water will have a major impact on the total water use figures as the areas are relatively small. KNYSNA | INTEGRATED STRATEGIC DEVELOPMENT FRAMEWORK | OCTOBER 2013
BRENTON WATER INFRASTRUCTURE KNYSNA | INTEGRATED STRATEGIC DEVELOPMENT FRAMEWORK | OCTOBER 2013
WATER INFRASTRUCTURE BELVIDERE • Water Sources Boreholes and Knysna WTW • Treatment Infrastructure - • Treatment Capacity - • Current Demand Avg/Peak(Dec) 0.3/0.45 Ml/day • Future Demand Avg/Peak(Dec) 0.45/0.7 Ml/day • Storage - • The current water demand is 110 Ml/annum. • Water is obtained from boreholes, with the Knysna WTW as supplementary source when required. KNYSNA | INTEGRATED STRATEGIC DEVELOPMENT FRAMEWORK | OCTOBER 2013
BELVIDERE WATER INFRASTRUCTURE KNYSNA | INTEGRATED STRATEGIC DEVELOPMENT FRAMEWORK | OCTOBER 2013
WASTE WATER INFRASTRUCTURE KNYSNA TOWN • Drainage Zones System is subdivided in 16 zones, all draining towards the Knysna Waste Water Treatment Plant (WWTW) via a network of collector sewers and rising mains • Treatment Infrastructure Activated Sludge Plant and SBR Plant • Treatment Capacity 8.2 Ml/day PDWF = 7.8 Ml/day • Pump stations 44 • The Plant was recently upgraded and was reported as being functional to 2020. • Allowing for proposed developments, the ultimate treatment capacity must be in the order of 13-15 Ml/d • Investigations are currently in process finding a suitable location for a new Treatment Works. PROBLEMS IDENTIFIED • Some sections in the reticulation was identified with insufficient capacity for the generated flows. • The topography dictates numerous pump stations. The maintenance thereof are problematic and costly KNYSNA | INTEGRATED STRATEGIC DEVELOPMENT FRAMEWORK | OCTOBER 2013
WASTE WATER INFRASTRUCTUREKNYSNA KNYSNA | INTEGRATED STRATEGIC DEVELOPMENT FRAMEWORK | OCTOBER 2013
WASTE WATER INFRASTRUCTURE SEDGEFIELD • Drainage Zones System is subdivided in 5 zones, all draining towards the Knysna Waste Water Treatment Plant (WWTW) via a network of collector sewers and rising mains • Treatment Infrastructure Activated Sludge Plant and Conservancy Tanks • Treatment Capacity 0.75 Ml/day PDWF = 1.7 Ml/day • Pump stations 17 • The estimated current average dry weather flow is within the capacity of the Works. • Approximately 1220 out of a possible 3200 erven is connected to the sewerage network, the balance are on conservancy tanks. • If the total area is reticulated, the ultimate treatment capacity should be 3-4 Ml/d, and previous recommendations was to extend the plant immediately to 2 Ml/d. • Upgrading proposals was tabled, Phase 1 being the upgrading of the existing works. • Final effluent is discharged into a infiltration pond west of the works. KNYSNA | INTEGRATED STRATEGIC DEVELOPMENT FRAMEWORK | OCTOBER 2013
WASTE WATER INFRASTRUCTURE PROBLEMS IDENTIFIED • As mentioned, the Works is sufficient for the average daily flows, but cannot handle the peak flows required. This are compounded when additional waste from the conservancy tanks are deposited by tankers. • The current configuration of the Works do not meet the Special Limits Values required for the final effluent. The quality of the effluent is a concern to DWA due to potential groundwater contamination. • Pump stations and the maintenance thereof are problematic and costly KNYSNA | INTEGRATED STRATEGIC DEVELOPMENT FRAMEWORK | OCTOBER 2013
WASTE WATER INFRASTRUCTURESEDGEFIELD KNYSNA | INTEGRATED STRATEGIC DEVELOPMENT FRAMEWORK | OCTOBER 2013
WASTE WATER INFRASTRUCTURE KARATARA • Drainage Zones Welsynsdorp (123 houses) are fully serviced. Bergvallei and Bosdorp are not connected to the sewer system • Treatment Infrastructure Activated Sludge Plant and Conservancy Tanks • Treatment Capacity 0.17 Ml/day PDWF = 0.20 Ml/day • Pump stations 2 • The Works are operating below its capacity, but it was noted that capacity problems was encountered during wet conditions. • Potential developments (340 erven) will increase the PDDWF to 0.38 Ml/d which will affect the effectiveness of the plant. • The Conditional Assessment report (2010) states the infrastructure as good. PROBLEMS IDENTIFIED • The Master Plan (2008) states the rising mains to the treatment works as overloaded. KNYSNA | INTEGRATED STRATEGIC DEVELOPMENT FRAMEWORK | OCTOBER 2013
WASTE WATER INFRASTRUCTURE RHEENENDAL • Drainage Zones Two zones exist, both pumping to the Treatment works • Treatment Infrastructure Activated Sludge Plant • Treatment Capacity 0.90 Ml/day PDWF = 0.20 Ml/day • Pump stations 2 • The total required future capacity required is in the order of 0.35 Ml/day, subject to further developments. • Effluent is discharged into the surrounding streams. • The Conditional Assessment report (2010) states the infrastructure in the good to excellent category. PROBLEMS IDENTIFIED • The current configuration of the Works do not meet the Special Limits Values required for the final effluent. The Plant’s inability to remove nitrates will make it difficult to attain Green Drop status KNYSNA | INTEGRATED STRATEGIC DEVELOPMENT FRAMEWORK | OCTOBER 2013
WASTE WATER INFRASTRUCTUREKARATARA AND RHEENENDAL KNYSNA | INTEGRATED STRATEGIC DEVELOPMENT FRAMEWORK | OCTOBER 2013
WASTE WATER INFRASTRUCTURE BRENTON • Drainage Zones Three zones exist, all pumping to the Treatment works • Treatment Infrastructure Hybrid STP • Treatment Capacity 0.34 Ml/day PDWF = 0.33 Ml/day • Pump stations 3 • The Sewer Master Plan (2008) records the development of a further 173 stands, which will result in a long term PDDWF of 0.329 Ml/d, still within the existing plants capacity. • Effluent is discharged into the sea. • The Conditional Assessment report (2010) states the infrastructure as varied, with some of the electrical components as poor. • Brenton on Lake have septic and holding tanks PROBLEMS IDENTIFIED • The current configuration of the Works do not meet the Special Limits Values required for the final effluent. The Plant’s inability to remove nitrates will make it difficult to attain Green Drop status KNYSNA | INTEGRATED STRATEGIC DEVELOPMENT FRAMEWORK | OCTOBER 2013
WASTE WATER INFRASTRUCTUREBRENTON KNYSNA | INTEGRATED STRATEGIC DEVELOPMENT FRAMEWORK | OCTOBER 2013
WASTE WATER INFRASTRUCTURE BELVIDERE • Drainage Zones Three zones exist, all pumping to the Treatment works • Treatment Infrastructure Beacon Watertec STP • Treatment Capacity 0.29 Ml/day PDWF = 0.20 Ml/day • Pump stations 3 • The average future flow is estimated at 0.2Ml/d, peaking at 0.35-0.4 Ml/d which will exceed the existing capacity of the plant. • Effluent is discharged into a artificial pond in Belvidere Estate. • The Conditional Assessment report (2010) states the infrastructure as good to fair. • Sections of reticulation have 0% capacity or in the 0-30% category capacity and cognisance to be taken thereof for future development in the area. BUFFALO BAY • Currently serviced by septic and conservancy tanks only. • A new Treatment Works is foreseen in the medium term and should have a capacity of 0.2 Ml/d KNYSNA | INTEGRATED STRATEGIC DEVELOPMENT FRAMEWORK | OCTOBER 2013
WASTE WATER INFRASTRUCTUREBELVIDERE KNYSNA | INTEGRATED STRATEGIC DEVELOPMENT FRAMEWORK | OCTOBER 2013