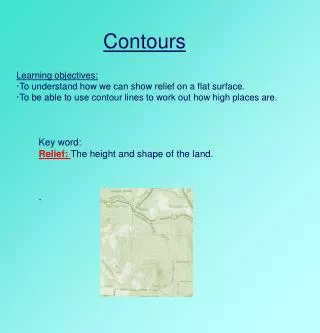
Contours
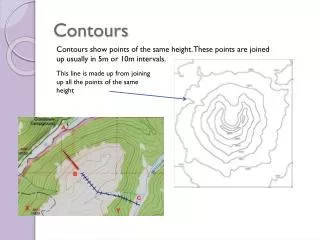
Contours. Contours show points of the same height. These points are joined up usually in 5m or 10m intervals. This line is made up from joining up all the points of the same height. Why do you think it is important to have contours on a map? Make a list with a friend of your answers.

Contours
E N D
Presentation Transcript
Contours Contours show points of the same height. These points are joined up usually in 5m or 10m intervals. • This line is made up from joining up all the points of the same height
Why do you think it is important to have contours on a map? Make a list with a friend of your answers. • ..................................... • .................................................... • .................................................................. • ........................................................................... • ..................................................................................... Here are a couple of examples: • To find level land for construction • or agriculture. • To design a pipeline
Activity 2: Contour Exercise Plot this pyramid using contours Chose a suitable scale Level at top=60mAOD Remember that a pyramid has 4x sides and this has a square base 50m Level at base=10mAOD 50m
Contour Exercise Is this what yours looked like? What is your scale? 1cm to 10m1:100? 10m 20m 30m 40m 50m 60m 60m 50m 50m
Drawing Maps We were able to plot the pyramid as we had the dimensions As we only wanted to plot the pyramid we did not need to know where it was relative to other areas Level at top=60m Level at base=10m But how do we plot a map if we do not have the co-ordinates or dimensions? 50m We need to carry out surveying 50m
Surveying • Surveying is the art and science of measuring and mapping land The main job of the surveyor is measuring, mapping, and observing
Here are some surveying tools: Theodelite alidade Dumpy Level Plane Table Leveling Staff GPS Tripod Compass Measuring Tape Tripod
Plane Table Survey A Plane Table provides a solid and flat surface to make field drawings, charts and maps A tripod is needed so that an even surface can be achieved on uneven ground Spirit/bubble levels are used to get horizontal surface level.
Plane Table Survey This is an Alidade which is used to sight objects of interest: Perpendicular straight edge ruler Eye piece Thread to bisect/spilt in half the point of interest
Plane Table Survey Youtube video http://www.youtube.com/watch?v=UMdPgp5oMRw