Download
1 / 1
10 likes | 116 Vues
This study focuses on the analysis of chlorophyll-a concentration and sea surface temperature in the East China Sea, leveraging MODIS data obtained from the Tokyo University of Information Sciences. It examines changes in primary productivity related to the operation of the Three Gorges Dam and its impact on the Changjiang River discharge. The research highlights seasonal variations, the influence of the Kuroshio current, and offers spatial resolutions of data crucial for environmental monitoring and policy-making. Users can access and download relevant datasets from our website.

E N D
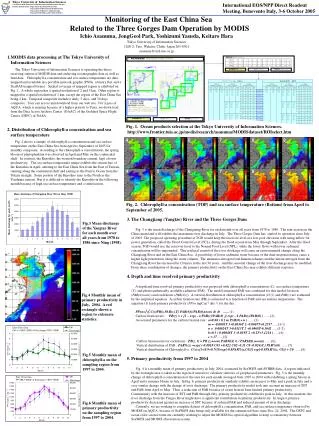
Tokyo University of Information Sciences Graduate School of Business Administration and Information Science Faculty of Informatics: Department of Information Systems Department of Environmental Information, Department of Business Administration Department of Media and Cultural Studies Ⅰ. 解析対象領域選択 Please select your region of interest. 東京情報大学 TUIS 東京情報大学 TUIS 入り口 Home 入り口 Home 領域選択 Select ROI 領域選択 Select ROI 4 5 6 7 8 9 ① 日本近海全域(5km及び2km分解能) ② 日本各地(1km分解能) ③ 東シナ海(2km分解能) 必要な領域をクリックします。 Please click your region of interest. The left region provides 5km spatial resolution. The right regions provide 1km spatial resolution. 4 5 6 7 8 9 International EOS/NPP Direct Readout Meeting, Benevento Italy, 3-6 October 2005 • MODIS data processing at The Tokyo University of Information Sciences • The Tokyo University of Information Sciences is operating the direct receiving station of MODIS data and archiving oceanographic data as well as land data. Chlorophyll-a concentration and sea surface temperature are data mapped and available in a portable network graphic (PNG), a binary flat, and a SeaDAS mapped format. Spatial coverage of mapped region is exhibited on Fig. 1. A whole region has a spatial resolution of 2 and 5 km. Other region is mapped in a spatial resolution of 1 km, except the region of the East China Sea being 2 km. Temporal composite include a daily, 5 days, and 30 days composite. User can access and download from our web site. For a pass of AQUA, which is missing because of a higher priority to Terra, we down load from the Data Active Archive Center (DAAC) of the Goddard Space Flight Center (GSFC) of NASA. • 2. Distribution of Chlorophyll-a concentration and sea surface temperature • Fig. 2 shows a sample of chlorophyll-a concentration and sea surface temperature on the East China Sea from April to September of 2005 for monthly composite. According to the chlorophyll-a concentration, the spring bloom of phytoplankton was observed in April and May on the continental shelf. In contrast, the Kuroshio, the western boundary current, kept a lower productivity. The sea surface temperature image exhibits the stream line of the Kuroshio in April, entering to the East China Sea from the East of Taiwan, running along the continental shelf and exiting to the Pacific Ocean from the Tokara straight. Some portion of the Kuroshio runs to the North as the Tsushima current. But it is difficult to identify the Kuroshio in the following month because of high sea surface temperature and a stratification. 期間選択 Select period Monitoring of the East China Sea Related to the Three Gorges Dam Operation by MODIS Fig. 1. Ocean products selection at the Tokyo University of Information Sciences. http://www.frontier.tuis.ac.jp/modis/research/asanuma/MODISdataset/ROIselect.htm Fig. 2. Chlorophyll-a concentration (TOP) and sea surface temperature (Bottom) from April to September of 2005. • 3. The Changjiang (Yangtze) River and the Three Gorges Dam • Fig. 3 is the mean discharge of the Changjiang River for each month over all years from 1978 to 1986. The rain season on the China main land will exhibits the maximum river discharge in July. The Three Gorges Dam has started its operation since July of 2003. The proposed operating procedure at TGD would keep the reservoir level at a low pool elevation with using inflow for power generation, called the Flood Control Level (FCL), during the flood season from May through September. After the flood season, TGD would rise the reservoir level to the Normal Pool Level (NPL), while the lower flows with lower sediment concentration will be impounded. This artificial control of the river discharge will cause an environmental change along the Changiang River and on the East China Sea. A possibility of lower sediment water because of the dam suspension may cause a higher light penetration along the water column. The ammonia-nitrogen from human exhausts and the nitrate-nitrogen from the Changjiang River has increased in 10 times in the last 30 years. And the seasonal change of the river discharge may be modified. From these combination of changes, the primary productivity on the East China Sea may exhibits different response. • 4. Depth and time resolved primary productivity • A depth and time resolved primary productivity was proposed with chlorophyll-a concentration (C), sea surface temperature (T), and photosynthetically available radiation (PAR). The model estimated PAR was combined for this model for noon (PAR(0,noon)) and each hours (PAR(0,t)). A vertical distribution of chlorophyll-a concentration (C(z)) and PAR(z) are estimated by the empirical equation. A carbon fixation rate (PB) is estimated as a function of PAR and sea surface temperature. The equation (1) leads primary productivity (PPeu mgC.m-2.day-1) for the day. • PPeu= t zC(z)PB{z,PAR(z),T} PAR(0,t)/PAR(0,noon) dz dt …... (1) • Carbon fixation rate : PB(z) = c {1 – exp( - a PAR(z)/PAR(0) )} exp( - b PAR(z)/PAR(0) ) ….. (2) • Associated parameters for the carbon fixation rate : a=0.04 ( 0.1 m PAR(0)+ n ) ….. (3) • m = -0.0001T 3+0.0036T 2 -0.0007T+0.2557 …..(3-1) • n = 0.00024T 3-0.0113T 2 +0.0868T-0.1042 …..(3-2) • b=0.3 ( 0.00048T 3 -0.019T 2 +0.1T+3.1214 ) …..(4) • c = 17 …..(5) • Carbon fixation rate for each hours : PB(z, t) = PB (z,noon) PARM(0, t) / PARM(0, noon)) ….. (6), • Vertical distribution of PAR : PAR%(z) =exp{ (-0.0018 C03 +0.022 C02 -0.11 C0 -0.024)Z } PAR%(0) ….. (7) • Vertical distribution of Chlorophyll-a : C(z)=[1-(0.9+0.7C0)exp{-0.8PAR%(z,C0)}] exp{-0.8PAR%(z, C0)} + C0…..(8) • 5. Primary productivity from 1997 to 2004 • Fig. 4 is a monthly mean of primary productivity in July, 2004, estimated by SeaWiFS and AVHRR data. A region indicated by the rectangle area is taken as the region of interest to calculate statistics of geophysical parameters. Fig. 5 is the monthly change of chlorophyll-a concentration of the area for each month averaged from 1997 to 2004 with exhibiting a spring bloom in April and a summer bloom in July. In Fig. 6, primary productivity similarly exhibits an increase to May and a peak in July and a very similar change with the change of river discharge. The primary productivity model took into account an increase of SST and PAR from April to May. Then, a reduction of PAR because of a rain front in June limited primary productivity. Continuously with the increase of SST and PAR through July, primary productivity exhibited a peak in July. At this moment, the river discharge from the Yangze River might have a significant contribution to primary productivity. In August, primary productivity decreased against an increase of SST because of reduced PAR and reduced amount of river discharge. • Currently, we are working to complete dataset of chlorophyll a concentration, PAR, and sea surface temperature observed by MODIS on AQUA, because of SeaWiFS data being only available for the commercial base since Dec. 24, 2004. The GSFC and ocean color science team are currently working to adjust the MODIS bio-optical algorithm to keep a consistency between SeaWiFS and MODIS observation system. Fig.3 Mean discharge of the Yangtze River for each month over all years from 1978 to 1986 since Ning (1998). Ichio Asanuma, JongGeol Park, Yoshizumi Yasuda, Keitaro Hara Tokyo University of Information Sciences 1200-2, Yato, Wakaba, Chiba, Japan 265-8501 asanuma@rsch.tuis.ac.jp Fig.4 Monthly mean of primary productivity in July, 2004. A red rectangle shows a region to calcurate statistics. Fig.5 Monthly mean of chlorophyll-a on the sampling region from 1997 to 2004. Fig.6 Monthly mean of primary productivity on the sampling region from 1997 to 2004.