Download
1 / 27
280 likes | 470 Vues
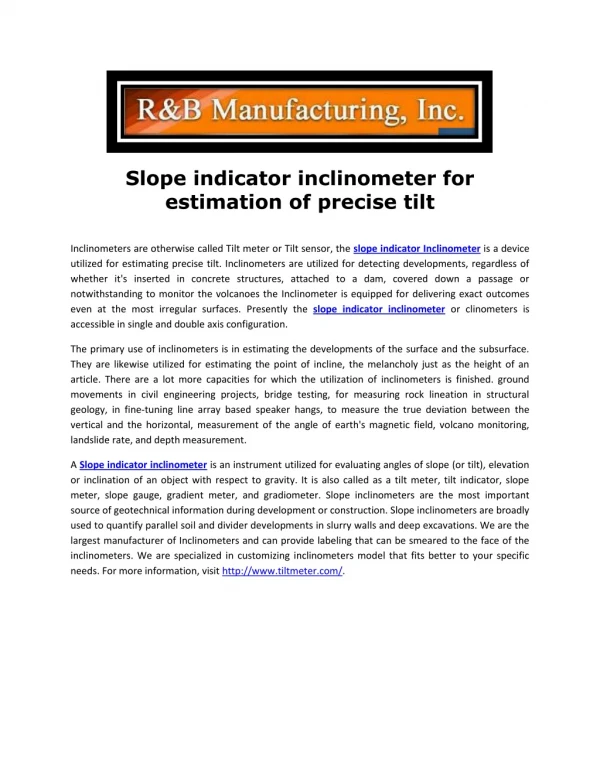
Quantifying Errors in Manual Inclinometer Field Measurements. Garrett Bayrd , L.E.G. Shannon and Wilson, Inc . . What is an inclinometer?. How do we know the accuracy of inclinometer readings?. Laboratory Tests Checksum Values Baseline Readings. Lab tests. Comparing readings.

E N D
Quantifying Errors in Manual Inclinometer Field Measurements Garrett Bayrd, L.E.G. Shannon and Wilson, Inc.
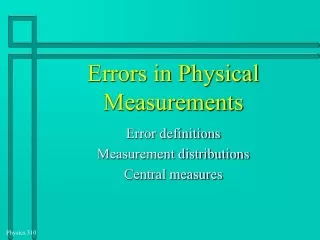
How do we know the accuracy of inclinometer readings? Laboratory Tests Checksum Values Baseline Readings
Comparing readings • When an inclinometer casing is read, two sets of readings are typically taken. The first set is then compared to the second, and the difference between these readings is called the checksum. • The average value of the checksum is good information about how repeatable the two readings were. • This does not, however, compare readings taken on one day to readings taken on another day.
We can’t determine the long-period accuracy of an inclinometer unless we have multiple readings in a casing that does not move.
I analyzed data from 8 casings that had not shown motion over more than 6 years. • Each casing had over 100 individual readings • One probe was used to measure these instruments
I worked with raw data to perform my analysis • Data pulled into excel. • Instead of comparing the readings to an initial reading, I compared the values to the average (mean) reading. • I used the deviation from the average reading as a measurement of both precision and accuracy. • This allowed me to determine how inaccurate a single set of readings could be.
Because I had accuracy data for each individual reading, I could see what independent variables contributed to the level of accuracy. • I checked to see if any of the following contributed to the level of accuracy: • The time of the year • The operator conducting the inclinometer readings • The inclination of the inclinometer casing • The variation of the inclination of the inclinometer casing • The total depth of the casing • The specific depth of the reading, i.e, is there more error at the top of the casing
Determining Error Levels. • To run these comparisons, I needed to know: • The accuracy of a single reading at a single depth. • The accuracy of an entire set of readings taken in one casing. • The accuracy of all of the sets of readings taken by a single operator. • The accuracy of all the readings at a specific depth.
So, I did some math I posit that: The accuracy of a single measurement at a single depth on a single day is the difference in value between that single measurement and the average measurement at that depth. Equation is: Where: A is the accuracy of a single measurement, Rd is the individual measurement at that depth, and Ra is the mean measurement at that depth
Then I did some more math: I want to know what the error of the reading for an entire casing would be: To calculate this, I take the sums of the absolute value of the difference between a single depth measurement and the average measurement for the entire set of readings. Equation is: Where: Eb is the total error in the casing, Dt is the top depth, and Db is the bottom depth
Even more math: To determine if the accuracy changed at different depths, I had to know the standard deviation of all the measurements at a single depth. Equation is: Where: Ad is the accuracy at that depth, Rd is the individual measurement at that depth, Ra is the average reading for that depth, and n is the number of measurements.
Last math: Taking the average of all of the standard deviations gives me a dimensionless value for the accuracy of all the readings in a single casing. Equation is: Where Ad is the average standard deviation, and n is the number of measurements taken, Tfis the first measurement taken, and Tl is the last reading taken. I use Sa as an average error value for an individual reading in the casing.
So, I first wanted to know what average levels of accuracy were. • I want to know this so I can figure out what a “bad” or “good” reading would be, so I can educate my clients on what level of accuracy to expect, and so I can better analyze my own data. • I find that: • The error level is smaller than I expected • 0.005 inches at a single reading, on average • Highest commonly encountered single depth reading 0.01 inches • On average, less than 0.1 inches of error per 100 feet accumulating from the bottom of the casing to the top • This compares well with the manufacturer’s stated 0.3 inches of error per 100 feet
Remember, I’m checking to see what variables contributed to the error levels: • The time of the year • The operator conducting the inclinometer readings • The inclination of the inclinometer casing • The variation of the inclination of the inclinometer casing • The total depth of the casing • The specific depth of the reading, i.e, is there more error at the top of the casing Let’s go through these, one by one.
Conclusions: • We are consistently able to achieve error less than 0.1 inches per 100 feet of casing. • The operator performing the readings influences the level of error. • The “wobbleyness” (change in angle) of the casing influences the error. • The upper 10 feet of the casings have greater levels of error than the rest.
I’d like to thank • Robert Clark, for general instrumentation information • Shannon and Wilson’s internal research grant program • Hollie Ellis for his assistance with statistical analysis • Jeremy Butkovich for programming assistance • Slope indicator for help with data reduction, and images