Theory of Measurements and Errors
290 likes | 975 Vues
Theory of Measurements and Errors. Readings. Before coming to the lecture, review the “Probability” concepts you learned earlier. Required readings: 3-1 to 3-15, 3-17. Required Figures: 3-1 to 3-6 Required Examples: 3-2 to 3-6. Introduction.

Theory of Measurements and Errors
E N D
Presentation Transcript
Readings • Before coming to the lecture, review the “Probability” concepts you learned earlier. • Required readings: 3-1 to 3-15, 3-17. • Required Figures: 3-1 to 3-6 • Required Examples: 3-2 to 3-6
Introduction • Measurements are never exact and willalways contain errors. • Units of Linear Measurements: • Metric, or international System of Units (SI) • English, used only in the US, Burma, and Liberia. Two definition of ft: • US survey foot = 0.3048006 m • International foot = 0.3048 m All surveys before 1959, as well as some states today, use the US survey foot. • The US is changing to the metric system.
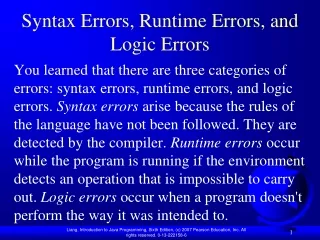
Errors • Any measurement includes errors, we can never find the true value, we can find the best estimate of the measured quantity. • Types of Errors: • Gross Errors (Mistakes): Large amounts, easy to find, must be eliminated before adjustment. • Systematic errors: Follow a mathematical function, can usually be checked and adjusted, and tend to maintain same sign
3. Random Errors: remains after eliminating gross and systematic errors. Impossible to compute or eliminate. They follow the probability laws, so they can be adjusted Their signs are not constant. Present in all surveying measurements. More observations result in a better estimate of them.
Precision and Accuracy • Precision: the degree of consistency of a group of measurements • Accuracy: The absolute nearness of measured quantities to their true values. • The shooting example, Figure 3-1. • Measurements are repeated to a maximum of 16 times, good observations are both precise and accurate. • Can we measure accuracy?
Probability • Error analysis involve random errors only. • Random errors occurrence is governed by the probability laws, as any random phenomena. • The most probable value of a single quantity observed many times under the same condition is the mean Oi M = n Residuals: the difference between any observation and it’s most probable value: vi = M - Oi
Error Distribution • Random errors are randomly distributed, a bell shape distribution that is approximated by the probability curve. • Consider tables 3-1 and 3-23-3 and 3-4 for definition of histogram, frequency polygon, and normal distribution curve. • General Laws of Probability: • small errors occur more often than large ones • Positive and negative errors of the same size happen with equal frequency, they are equally probable. That is why the mean is the most probable value.
Measures of Precision • standard deviation is the most frequently used measure of precision. The less precise the observations are, the larger the standard deviation becomes • The standard deviation is the inflection point of the curve, it represents how much the observations are close to each other. • It has a probability of 68.27. That means 68.27 of the observations will be in the range of
Error Propagation • To compute the standard deviation of a quantity measured indirectly: coordinates, stadia length, Azimuth, etc. • How the errors accumulate from the measured quantities to the computed quantity? • The problem: given the standard deviation of measured observations and a mathematical model to compute a certain quantity, what is the standard deviation of the computed quantity?
General Law of Error propagation • if u = f(x1, x2, x3, …, xn) • then u2= • Examples: area, Stadia, Distance, Coordinates
Mathematical Models • Area A = L * W then: X1 = L and X2 = W • Stadia: H = 100 *I for a level, = 100 * I * cos2 V = 100 * I * sin * cos • Coordinates: X = d *sin (AZ) Y = d *cos (AZ)