Regional Traffic Volume Data Analysis for Transportation Planning
130 likes | 233 Vues
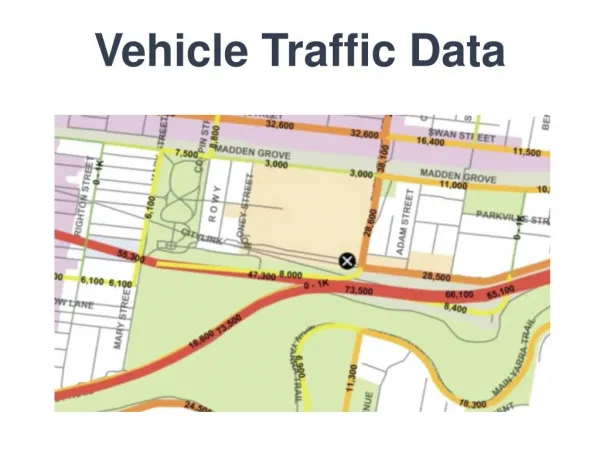
This report details the collection, analysis, and organization of traffic count data in the Regional Transportation Data Clearinghouse. It includes information on volumes recorded since 2001, station-link assignments, sources of AADT/AAWDT data, and tools for traffic volume queries.

Regional Traffic Volume Data Analysis for Transportation Planning
E N D
Presentation Transcript
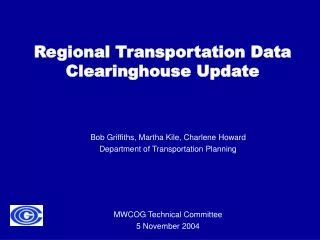
Traffic Count Data in theRegional Transportation Data Clearinghouse Martha Kile and Yew Yuan TPB Travel Forecasting Subcommittee January 18, 2008
Previous Clearinghouse Versions • Prior to 2001 printed reports were used to populate volumes • Volume recorded on several links • Only included AADT • May 2001 hourly/directional volumes • Distributed as ArcView 3.2 project • Traffic Volume file contained all years and link descriptive information
New Clearinghouse • Volumes since 2001 are populated only for the link on which the volume was taken • Used digital files indicating counting station location • Matched each count station to the corresponding Clearinghouse link • Used both spatial and attribute analysis • Identified links that should be treated differently • Multiple stations assigned to one link • Parallel facilities
New Clearinghouse (continued) • Included both AADT and AAWDT where available starting in 2005 • Count Type indicates source and vintage of count • ArcGIS • Several Tables • Descriptive information and traffic volumes are stored separately • Smoothing and Averaging for maps not in the main data file • Estimated volumes not carried in data file • Eliminates confusion of which volumes to use
Sources of AADT/AAWDT • Maryland • 2001-2004 Maryland SHA – AADT by station identifier • 2005 and 2006 AADT and AAWDT by station identifier • Virginia • 2001-2006 VDOT (Richmond) AADT and AAWDT by station identifier • Arlington County DPW (from Website) AADT 2001-2004 • DC • AADT from DC HPMS Submission 2001-2006 • West Virginia (Jefferson County) • AADT from Jefferson County Traffic Volume Map 2002 and 2005
How AADT/AAWDT is assigned to a link • Each station location is assigned to a link • XY location and location description • Links that have a one-to-one relationship with a station • Link is assigned the AADT and AAWDT of the station • CT code indicates the vintage of the counts • Links that are assigned multiple stations • Most recent AADT and AAWDT • Mean of the most recent AADT and AAWDT
Sources of Detailed Volumes • Hourly Directional Volumes (at standard counting locations) 2001-2006 • MD SHA • VDOT • DDOT (2004-2005) • Supplemental Counts where available • Short Term and Turning Movement • VDOT Northern Virginia • MD SHA • Montgomery County • DDOT
ArcGIS Application • Current GIS Software • Relational Database • Estimated volumes used for mapping are not carried in the data files. Eliminating confusion of which volumes to use • Menu for Traffic Volume Queries • By Route • By Year • By Project-ID
Traffic Volume Queries - Year - Count Type - Route ID - Project ID - Year - AADT/AAWDT - Detailed Counts Month Day of Week
Conclusions • Goals • Make traffic volume data • More accessible • More accurate • More meaningful • Sources for Additional Traffic Counts? • Need for Additional Functionality?