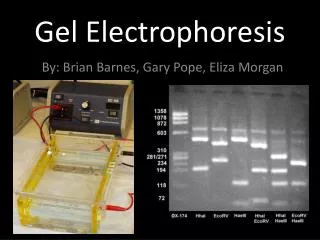
Electrophoresis
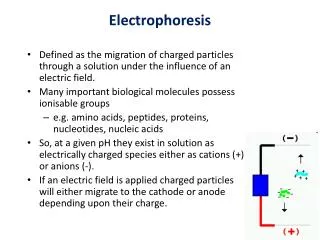
Electrophoresis. Separation, analytical or preparative, of charged molecules by migration through a matrix due to application of an electric field, with net movement towards electrode of opposite charge. General Principle.

Electrophoresis
E N D
Presentation Transcript
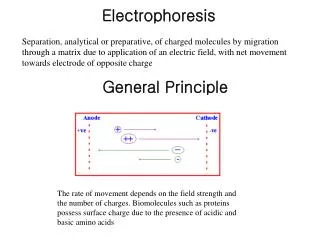
Electrophoresis Separation, analytical or preparative, of charged molecules by migration through a matrix due to application of an electric field, with net movement towards electrode of opposite charge General Principle The rate of movement depends on the field strength and the number of charges. Biomolecules such as proteins possess surface charge due to the presence of acidic and basic amino acids
Transport of molecule in solution F=fv f : frictional coefficient due to flow of solvent around moving object v : velocity of object For spheric molecule with radius R f= 6pR(Stoke’s law) R : particle radius : Solvent viscosity In Electrophoresis…. Velocity(v) of movement of a charged molecule in electrical field E F=fv=qE v= Eq/f f : frictional coefficient q : net charge of on the molecule Electophoretic mobility of a sample U=v/E=Eq/Ef=q/f= q/6pR R : particle radius : Solvent viscosity Seperation by Size & net charge
Separation can be effected by either or both major components • Size/shape • Charge • Both size/shape and charge • Electrophoresis is not always run to endpoint- if molecules are detected in matrix, empirical endpoint chosen such that all molecules still in matrix
Estimating molecular size by determining electrophoretic mobility • Mobility, Mr = distance migrated by band of interest/distance migrated by dye front • Mr is related to logMW or log of molecular size in bp in a linear fashion, therefore plot standards and can determine sizes of unknowns
Estimating molecular size by determining electrophoretic mobility Log MW Distance from origin, cm
Classification • DNA/agarose- horizontal; separation by size/shape • RNA/agarose- horizontal; denaturing; separation by size • Protein/polyacrylamide- vertical • separation by size- SDS-PAGE (denaturing) • separation by size and charge-native (non-denaturing) • separation by charge (pI)- isoelectric focusing • separation by charge, then size- 2D PAGE (denaturing) • Capillary Electrophoresis
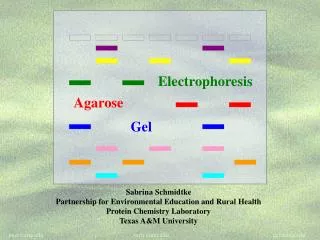
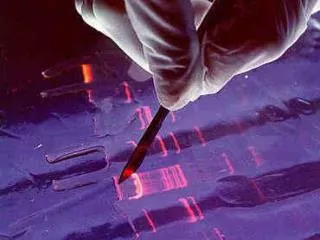
DNA/Agarose Gel Electrophoresis • Horizontal submarine electrophoresis most common; simplest separation by size • Agarose concentration 0.3-3% • Buffer most often Tris-Borate-EDTA (TBE) at 1X or 0.5X; sometimes Tris-Acetate-EDTA (TAE) at 1X (recipes- Maniatis, Current Protocols) • Detection of DNA is generally by ethidium bromide intercalation (dye in gel, in buffer, in sample, or in immersion solution after run) or by other dyes (e.g., Sypro)
Agarose Good separation of all but smallest DNAs- mid-range to large pore size provides sieving effect; relatively inert Linear polysaccharide derived from seaweed extract; composed of repeating units of agarobiose When dissolved by heat in aqueous solution, then cooled, agarose solution gels due to formation of inter- and intra-chain H bonds => The higher the concentration, the smaller the pore size
Preparing and running an agarose gel • Suspend agarose in running buffer (NOT H2O) to desired concentration • Heat to boiling; once dissolved, cool to ~65oC; add EtBr if desired to 1 µg/ml; pour into gel tray with comb to form wells; let set completely • Prepare DNA samples- add loading dye to 1X (provides high density to allow sample to sink, and provides dye for monitoring migration) • Remove comb from gel, set up in tank and submerge in buffer • Load samples by pipetting slowly through buffer into wells • Attach leads to tank and power supply; set V so I < 60 mA • Agarose concentration needed is determined by sizes of DNA fragments to be separated • for fragments between 0.3 and 3 kb, 0.7-1% are good standard concentrations • to separate small fragments (0.2-0.7 kb) from one another, use 1.5-3% (smaller pore size) • for separation of larger fragments (>3 kb and less than 30 kb) use 0.3-0.5%
Polyacrylamide Gel Electrophoresis (PAGE) Acrylamide Bis-acrylamide Polyacrylamide + TEMED
Disc(Discontinuous) PAGE • the Cl- ions move ahead of the proteins and glycine as the glycine is only partially dissociated at pH 6.7 • high conductivity, a low voltage gradient in front of the protein. • The slower moving glycine ions result in a region of low conductivity, hence a high voltage gradient behind the proteins. • Protein stacking between the chloride and glycine ions
Polymerization of acrylamide-Reaction • Polymerization is catalyzed by addition of catalysts- ammonium persulfate and TEMED • TEMED catalyzes sulfate radical (SO4-.) formation from persulfate; sulfate radical attacks acrylamide monomers, which then polymerize
Polyacrylamide gel casting- percentage acrylamide • Total percentage of acrylamide- acrylamide and bis-acrylamide- determines pore size of gel • Discontinuous (disc) gels are most common for highest resolution: Low percentage (3% is usual) and low pH (6.8) are used for stacking gel- all proteins run readily through until hit higher percentage and pH (8.6) of running or separating gel (4-20%), then stack up due to change in pH before migration into running gel and separation by charge and/or size
Polyacrylamidegel casting- modifications • Gradient gels offer highest resolution from complex mixtures and for two or more proteins with similar mobility • Often 4-20%, although several other percentage ranges are used comonly • Migration of proteins slows considerably as reach small pore size relative to protein size -> sharp banding • Precast gels are available in many formats, including gradient • Reproducibility • Cost-effective if not too many used/day • Convenient
‘Native’ PAGE - - - + + + High M.W. Low M.W. • Problems with ‘native’ PAGE • Oligomeric proteins • Charge Density • Shape
SDS-PAGE : separation by size • Denaturing method relying on two components- SDS and reducing agents • Sample is treated with both SDS and DTT or b-ME at elevated temperature; reducing agent ensures all disulfide bonds are reduced and SDS denatures and coats protein with basically uniform charge density (~1.4g SDS/g protein)- native charge masked and native shape lost so separation primarily by size • Again, linear relationship of logMW and Mr allows MW estimation from comparison with standard curve
Detection of protein using Coomassie Staining Coomassie Brilliant Blue is a common stain for protein gels. Staining is carried out in methanol + acetic acid, which acts to fix proteins in gel. Staining is carried out hours to overnight, depending on protein amount and gel thickness; destaining is required to reduce background- methanol/acetic acid without dye. Coomassie binds to most proteins with similar affinity, but not all. Binding is based on mostly ionic interaction (basic amino acids with -SO3- on Coomassie) plus some hydrophobic interaction with Coomassie rings. Lower limit for protein band detection by Coomassie staining is ~10-100 ng.
Isoelectric Focussing(IEF) pI pH gradient in gel by ampholyte pH In stable pH gradient in gel or capillary, each protein molecule Migrate toward position of their pI. At this point, their net charge is zero and migration stops
Ampholyte/pH Gradient Formation • Chemical Structure of • Ampholyte • b) Left : in the absence of • electric Field • Right : in the presence of • electric field
Capillary Electrophoresis (CE) • Disadvantages of traditional electrophoresis • Long analysis times • Lack of resolution • Difficulties in detection • Difficult to automate • Capillary electrophoresis • Automated high-resolution approach to electrophoresis. • Separation is carried out in a microbore fused-silica capillary, • around 25-75 µm internal diameter. • The separation takes place is free solution and convection • currents are controlled by the capillary. • Application • Analysis of proteins, nucleic acids, peptides, carbohydrates, anions, cations, vitamins, organic acids, amino acids, pesticides, even whole cells and viruses.
Two Dimensional Electrophoresis IEF or IPG (pI) + SDS-PAGE (Size)
Gel Filtration Chromatography • Separation based on size • (molecular exclusion or gel permeation chromatography) • Stationary phase : porous beads with a well-defined range of pore sizes • Mobile phase : buffer/solvent containing sample to be seperated
Principles of Gel Filtration Elution Volume Void volume Total Volume Distribution Constant • Small proteins have access to the mobile phase inside the beads as well as the mobile phase between beads and elute last. • Large proteins have access only to the mobile phase between the beads and, therefore, elute first. • Proteins of intermediate size will then elute between the large("excluded") and small ("totally included") proteins
Molecular Weight Determinatin by GFC LogMW Kd 1. Determination of Vo : by Blue Dextran 2. Calibration with Standard MW marker 3. Sample Running & Ve Determination 4. Calculation of Kd 5. Calculation of MW
Application • Purification of Protein • Buffer Exchange/Desalting • Molecular Size Determination
Sedimentation Method :Analytical Ultracentrifugation With Analytical Ultracentifugation the following protein characteristics can be determined: Native Molecular Mass Stoichiometry Assembly Models Conformation & Shape Diffusion & Sedimentation Assiociation
Native Molecular Mass • the only technique which you can determine accurately the native molecular weight of a protein. • The obtained molecular weight is usually within 5% of the • calculated value based on the protein sequence. • range of molecular weights :approx. 2.5 kDa up to 1.5 MDa. • A typical experiment takes about 16 hours • Stoichiometry • The stoichiometry of a protein complex can be calculated from the determined molecular mass.
Assembly Models • The assembly of a protein complex can be calculted from the determined molecular mass. It is even possible to follow the assembly when the different partners are added to the mixture one by one. • Ligand binding can also be analyzed using sedimentation velocity methods if the ligand and acceptor differ greatly in their sedimentation coefficients. • Alternatively, a thermodynamic analysis may be made using sedimentation equilibrium methods.
Conformation & Shape Information about the shape and the conformation of a protein as well as the interaction between macromolecules can be obtained from the sedimentation and diffusion coefficients obtained from a sedimentation velocity experiment. Sedimentation coefficients are particular useful for monitoring changes in conformation of a protein. The resulting model for the overall shape of the protein or protein complex can be compared with images obtained by electron microscopy to assess how applicable those images are to the behaviour of these particles in solution. Assiociation Unlike other methods for the study of binding processes, the sedimentation equilibrium method is particularly senstive for the study of relatively weak associations with associations constants (Ka) in the order of 10-100 M-1. However, also binding processes with Ka values significantly greater than 107 M-1 can be studied
Centrifugation:Physical Basis Archimedes’s Principle m=m0-m0 ρ m : buoyant mass : partial specfic volume ρ : solvent density Centrifugal Force F=mrω2ω : angular velocity of rotation Combing two equations F=fv=m0(1- ρ)rω2 Multiplying by Avogadro’s number M(1-ρ)/Nf = v/w2r = s(Sedimentation Coefficient)
Svedberg Equation f= RT/ND D : Diffusion Coefficient F=fv=m0(1- ρ)rω2 s=m0(1- ρ)/(RT/ND) RTs=NDm0(1- ρ) Mr=RTs/D(1- ρ) Svedberg equation R : physical constant D,T, ρ : Experimental Condition s, : Intrinsic physical properties of particle
Equipment Outline design of AUC
Experimental Set-Up Assembly of Cell
Sedimentation Velocity Analysis The behavior of particles as they move through the solvent during sedimentation at high centrifugal speed Apparent sedimentation coefficient The velocity of sedimentation v is v=drb/dt = rbw2s Integrating ln [rb(t)/rb(t0)]=w2s(t-t0) We can calculate s value J=-D(dr/dc) J : diffusive flux c: conecntration of solute Determination of M D/s=M(1- ρ )/RT
Sedimentation Equilibrium Analysis A small volume of an initially uniform solution is centrifuged at a somewhat lower angular velocity than required for a sedimentation velocity experiment. As the solute begins to sediment towards the bottom of the cell and the concentration at the bottom increases, the process of diffussion opposes the process of sedimentation. After an appropiate period of time, the two opposing forces reach equilibrium The flow of solute due to sedimentation (black arrows) increases with radial distance. This process is balanced at equilibrium by the reverse flow from diffusion (open arrows) M=[2RT/(1- ρ)w2](lncr)/ca[1/(r2-a2)] cr : concentration of solute at distance r ca: concentration of solute at meniscus a : distance of the meniscus from axis of rotation lncr vs. r2 plot M(1-ρ)/2RT slope
Data Analysis • To analyze the data of a velocity analysis, there are 3 programs available: • Ultrascan on unix • SVEDBERG for Windows 95/98 • dc/dt for Windows 95/98 • Sedterp for Windows 95/98 for determination of the partial specific volume of a protein and the density of the solute • For the equilibrium analysis • Windows 95 program called Ultrascan which is installed on the XLA-pc. • Nonlin for Windows 95/98 can be used to determine the association constants for associating systems