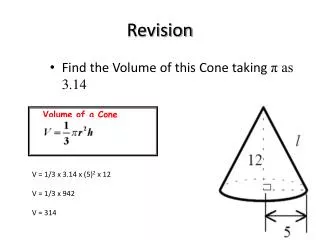
Revision
Revision. Sampling error generally decreases as the sample size increases . depends on the size of the population under study. depends on the variability of the characteristic of interest in the population. can be accounted for and reduced by an appropriate sample plan. Data.

Revision
E N D
Presentation Transcript
Revision Sampling error generally decreases as the sample size increases . depends on the size of the population under study. depends on the variability of the characteristic of interest in the population. can be accounted for and reduced by an appropriate sample plan.
Data • Kinds of information obtained from research participants, e.g. • Demographic info • Scores • Responses to questions • Essays • Grade-point-averages • Performance logs (sports) • Anecdotal records
Definition • Instrument = the device used to collect data • Instrumentation = the whole process of preparing to collect data; involves • Selection or design of instrument(s) • Procedures and conditions under which the instrument(s) will be administered
Questions you would HAVE to ask… • Where will the data be collected? (location) • When will the data be collected? (time) • How often are the data to be collected? (frequency) • Who is to collect the data? (administration) • These are equally important as obtaining a ‘good’ instrument…! • Location, time, frequency, and administration are affected by the kind(s) of instrument to be used…!
Obtaining information • Researcher instruments (tally sheet, field notes) • Subject instruments (weekly spelling test, questionnaire, daily log) • Informant instruments (rating scale, anecdotal records, interview schedule)
4 major ways to collect research data: • Administer a standardized instrument • Administer a self-developed instrument • Record naturally occurring events (observations in a classroom) • Using already available data set (G.P.A., etc.)
Constructing your own instrument…problems? • Not easy • ‘good’ instrument takes lots of time to develop • Skills? Money? Energy?
Alternative? Use already existing instruments
Examples of data collection instruments Activity • List as many instruments that you already know (used or heard about) • Turn to your neighbor • Pair of pairs
Rating Scales • Making judgment about a behavior or a product • Rating = observation + judgment • Observation = check the existence or non-existence of something • Behavior rating scales • Numerical rating scale • Graphic rating scale • Product rating scales (reports, maps, charts, diagrams, drawings, notebooks essays, etc.)
Interview Schedules • Set of questions to be answered by subjects • Oral (written or recorded) • Clarification possible • Takes longer time • Inhibition (researcher’s presence) • Structured interviews - the questions and their sequence, is predefined (systematic) – clear goals • Unstructured interview - more free; interviewee develops the themes proposed by the interviewer – exploration of emotions, etc. (Rogerian counseling) • Semi-structured interviews – mixture of both • Open-ended questions • Closed-ended questions
Tally sheets • To record the frequency of behaviors, activities, or remarks
Performance Checklists • List of behaviors that make up a certain type of performance • Used to determine whether or not an individual behaves in a certain way when asked to complete a particular task
Anecdotal records • A record of observed behaviors written down in the form of anecdotes (short story) • No set format • Must be specific, factual and avoid evaluative, interpretive, and overly generalized remarks • Must use concrete descriptive statements
Questionnaires • Save time and energy • No way of clarifying answers/responses • Selection items - Multiple choice, true-false, matching, or interpretive questions • Supply items – short answer, essay
Self-checklists • Subjects asked to study a list and place a mark opposite characteristics they possess or the activities in which they have engaged for a particular length of time
Attitude Scales • Likert scale – commonly used attitude scale • Semantic deferential – measure a subject’s attitude toward a particular concept • Pictorial attitude scale
Personality (or character) inventories • Minnesota Multiphasic Personality Inventory • IPAT Anxiety Scale • Kuder Preference Record
Achievement Tests • Measure an individual’s knowledge or skill in a given area or subject
Aptitude Tests • Intended to measure an individual’s potential to achieve in a given area
Performance Tests • Measure an individual’s performance on a particular task • E.g. typing, driving, etc.
Projective Devices • Instrument with a vague stimuli that allows individuals to project their interests, preferences, anxieties, prejudices, needs, et. • No ‘right’ or ‘wrong’ answers • No clear-cut answer of any sort • Wide variety of response possible • E.g. • Rorschach Ink Blot Test • Thematic Apperception Test (TAT)
Sociometric Devices • Ask individuals to rate their peers in some ways • E.g. • Sociogram – visual representation, usually by means of arrows, of the choices people make about other individuals with whom they interact • Group play – assigning roles to different individuals in a group play – to illustrate individuals’ interpersonal relationships
Measurement Scales • Nominal scales – assign numbers to different categories to show difference • Ordinal scales – order data in some way (high to low; least to most) – relative standing - ranking • Interval scales – characteristics of 1 & 2 plus distances between points on the scale are equal • Ratio scales – characteristics of 1, 2, & 3 plus a true ‘zero’ point
So what? Questions: • Which of these four provides the least information? • Which of these four provides maximum amount of information? • How does the knowledge about different scales of measurement affect your research? (which part of research?)
Think in terms of ‘the purpose/truthfulness of tests’ and the ‘consistency’ with which the purpose is fulfilled/met Validity and Reliability Neither Valid nor Reliable Reliable but not Valid Fairly Valid but not very Reliable Valid & Reliable