Evaluating Adverse Reactions to Whooping Cough Vaccination: A Statistical Approach
This analysis explores the adverse reactions to the whooping cough vaccine in infants. With data on 339 infants where 69 reported reactions, we will construct a 95% confidence interval for the probability of adverse reactions. Further, we will determine the required sample size to estimate this probability within a margin of 0.01. Additionally, we'll look into studying adverse reactions in another population without prior knowledge, assessing necessary sample sizes for accurate estimation. We will also cover chi-squared goodness-of-fit tests for allele inheritance traits.

Evaluating Adverse Reactions to Whooping Cough Vaccination: A Statistical Approach
E N D
Presentation Transcript
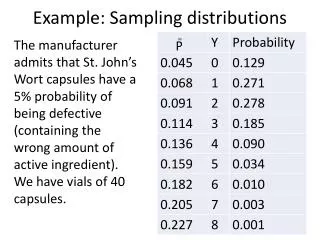
Example: Sampling distributions The manufacturer admits that St. John’s Wort capsules have a 5% probability of being defective (containing the wrong amount of active ingredient). We have vials of 40 capsules.
Example: C.I. for p̃ To evaluate the policy of routine vaccination for whooping cough, adverse reactions were monitored for 339 infants who received their first injection of the vaccine. Reactions were noted in 69 of the infants. a) Construct a 95% C.I. for the probability of an adverse reaction and interpret it. b) Suppose that we wanted to extend our vaccination study to estimate p to within 0.01 with a 95% confidence. How many infants would we need to look at?
Example: C.I. for p̃ To evaluate the policy of routine vaccination for whooping cough, adverse reactions were monitored for 339 infants who received their first injection of the vaccine. Reactions were noted in 69 of the infants. c) Suppose that we wanted to study the adverse reactions to infants in another country where we had no prior knowledge of the number of adverse reactions. How many infants would we need to look at to estimate p to within 0.01 with a 95% confidence?
Example: C.I. for p̃ To evaluate the policy of routine vaccination for whooping cough, adverse reactions were monitored for 339 infants who received their first injection of the vaccine. Reactions were noted in 69 of the infants. Construct a 95% C.I. for the probability of an adverse reaction and interpret it. Suppose that we wanted to extend our vaccination study to estimate p to within 0.05 with a 95% confidence. How many infants would we need to look at? Construct a 99% C.I. for the probability of an adverse reaction and interpret it.
2 distribution http://cnx.org/content/m13129/latest/chi_sq.gif
Details for 2 Goodness-of-Fit • State the scientific question to be answered. • Define pi’s for each category • State the H0 and HA. In H0: provide the theoretical values for the pi’s These may be explicit or implied (e.g., 9:3:3:1 ratio) in the question. The sum of the pi’s must be 1. If only two categories, state HA with symbols as well as words can be both directional and nondirectional If more than two categories, state HA in words only cannot be directional.
Details for 2Goodness-of-Fit (cont) • State the significance level a. • Calculate Ei = npi for each category. Verify that all the Ei are at least 5 If not, stop; cannot use this test. Calculate by summing over all categories. • State the rejection region. Compare with 2dfcritical value with df = number of categories -1 Reject H0 if test statistic is greater than the critical value
Details for 2 Goodness-of-Fit (cont) • Compare the test statistic to the rejection region or compare the P-value to a. • Make a decision about the null hypothesis. • State the conclusion in the terms of the context of the problem.
Example 1: 2 distribution In the sweet pea, the allele for purple flower color (P) is dominant to the allele for red flowers (p), and the allele for long pollen grains (L) is dominant to the allele for round pollen grains (l). The first group (of grandparents) will be homozygous for the dominant alleles (PPLL) and the second group (of grandparents) will be homozygous for the recessive alleles (ppll). We are interested in the F2 population. Are the two traits 25.5 cM apart? Observations: 381 F2 offspring 284 purple/long, 21 purple/round, 21 red/long, 55 red/round
Example 2: 2 distribution There are two homozygous lines of Drosophlia, one with red eyes and one with purple eyes. It has been suggested that there is a single gene responsible for this phenotype, with the red eye trait dominant over the purple eye trait. If that is true we expect these two lines to produce F2 progeny in the ratio 3 red: 1 purple. We want to test the hypothesis that red is (autosomal) dominant. To do this we perform the cross of red-eyed and purple-eyed flies with several parents from the two lines and obtain 43 flies in the F2 generation, with 29 red-eyed flies and 14 purple-eyed flies.