Process Variability and Capability
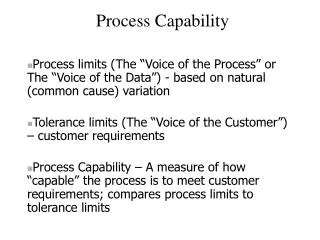
Process Variability and Capability. Operations Management Dr. Ron Lembke. Designed Size. 10 11 12 13 14 15 16 17 18 19 20. Natural Variation. 14.5 14.6 14.7 14.8 14.9 15.0 15.1 15.2 15.3 15.4.

Process Variability and Capability
E N D
Presentation Transcript
Process Variability and Capability Operations Management Dr. Ron Lembke
Designed Size 10 11 12 13 14 15 16 17 18 19 20
Natural Variation 14.5 14.6 14.7 14.8 14.9 15.0 15.1 15.2 15.3 15.4
Theoretical Basis of Control Charts 95.5 % of values within 2σ
Theoretical Basis of Control Charts 99.7 % of values within 3σ
Skewness • Lack of symmetry • Pearson’s coefficient of skewness: Positive Skew > 0 Negative Skew < 0 Skewness = 0
Kurtosis • Amount of peakedness or flatness Kurtosis = 0 Kurtosis > 0 Kurtosis < 0
Heteroskedasticity Sub-groups with different variances
Design Tolerances • Design tolerance: • Determined by users’ needs • UTL -- Upper Tolerance Limit • LTL -- Lower Tolerance Limit • Eg: specified size +/- 0.005 inches • No connection between tolerance and • completely unrelated to natural variation.
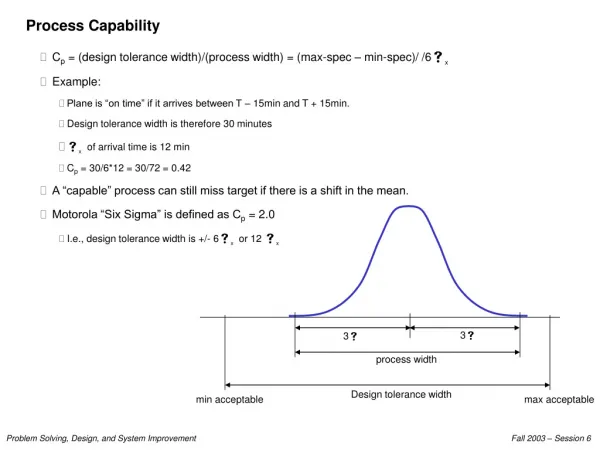
LTL UTL 6 Process Capability and 6 LTL UTL 3 • A “capable” process has UTL and LTL 3 or more standard deviations away from the mean, or 3σ. • 99.7% (or more) of product is acceptable to customers
LTL LTL UTL UTL LTL UTL Process Capability Capable Not Capable LTL UTL
Process Capability • Specs: 1.5 +/- 0.01 • Mean: 1.505 Std. Dev. = 0.002 • Are we in trouble?
Process Capability • Specs: 1.5 +/- 0.01 • LTL = 1.5 – 0.01 = 1.49 • UTL = 1.5 + 0.01 = 1.51 • Mean: 1.505 Std. Dev. = 0.002 • LCL = 1.505 - 3*0.002 = 1.499 • UCL = 1.505 + 0.006 = 1.511 Process Specs 1.499 1.511 1.49 1.50 1.51
Capability Index • Capability Index (Cpk) will tell the position of the control limits relative to the design specifications. • Cpk ≥ 1.0, process is capable • Cpk< 1.0, process is not capable
Process Capability, Cpk • Tells how well parts produced fit into specs Process Specs 3 3 LTL UTL
Process Capability • Tells how well parts produced fit into specs • For our example: • Cpk= min[ 0.015/0.006, 0.005/0.006] • Cpk= min[2.5,0.833] = 0.833 < 1 Process not capable
Process Capability: Re-centered • If process were properly centered • Specs: 1.5 +/- 0.01 • LTL = 1.5 – 0.01 = 1.49 • UTL = 1.5 + 0.01 = 1.51 • Mean: 1.5 Std. Dev. = 0.002 • LCL = 1.5 - 3*0.002 = 1.494 • UCL = 1.5 + 0.006 = 1.506 Process Specs 1.49 1.494 1.506 1.51
If re-centered, it would be Capable Since 1.67 > 1, process would now be Capable Process Specs 1.49 1.494 1.506 1.51
LTL UTL What if Not Capable? • We can’t sell everything we make to these people • Find less choosy customers? • Measure & sort all for them? • Shifting the Mean • Not trivial, may be easy • Adjust a setting? • Reducing variability – Hard! • Process varies over time • Find and get rid of variability • Training workers, new equip? LTL UTL
Summary • All processes exhibit variability • Reviewed some basic statistical concepts • Defined process capability measurement, Cpk • Difficulties of making a process capable