Interactions
Interactions. POL 242 Renan Levine March 13/15, 2007. Recap. Learned how to do bivariate analyses Cross-tabs, measures of association, correlations. Added variables. Learned to do multivariate regression analyses. Learned to interpret coefficients when controlling for all other variables.

Interactions
E N D
Presentation Transcript
Interactions POL 242 Renan Levine March 13/15, 2007
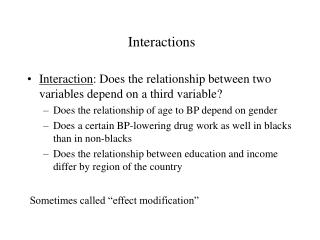
Recap • Learned how to do bivariate analyses • Cross-tabs, measures of association, correlations. • Added variables. • Learned to do multivariate regression analyses. • Learned to interpret coefficients when controlling for all other variables. • Today: What if relationship between one IV (X) and the DV (Y) is different at different levels of another variable?
Start with a basic bivariate relationship X Y Question: Will this relationship be the same at all levels of Z???
X X Y Y Focus on the relationship When Z = α Can be positive or negative. Can be strong, weak or have no effect. ? When Z = β NOT what is the effect of Z on Y. See Pollock p. 86 for a complete set of possible interactions.
Step 1 • Go back to contingency tables or correlations. • Recode variables if necessary (reduce number of categories). • Run a different cross-tab (or correlation) for each value of Z • Look to see if relationship changes. • Are the measures of association different?
Focus is on X & Y • The question is: • Did the relationship between X and Y change at different levels of Z? • Did the relationship get weaker? stronger? • Did the sign change or stay the same? • Focus on the relationship between X & Y • Not on how Z affects Y until Step 2…
Step 2 • Run a cross-tab or a correlation between new variable and the independent variable. • Is there a relationship?
Evaluate • Is new variable affecting the IV, the DV, and/or the relationship between the DV and the IV. • Spurious? • Specification? • Antecedent? • Reference your qualitative research!
Possible Outcome - I • Relationship between independent and dependent variables remains unchanged & • New variable is not related to dependent variable. • What to do: Eliminate new variable from further analysis UNLESS you anticipate that people will expect this variable to be included and you need to demonstrate it has no effect. • You can have IVs that are control variables and have no hypothesized effect on the DV
Possible Outcome - IIA • Relationship between independent and dependent variables remains unchanged BUT • New variable is related to dependent variable. • What to do: Consider adding new variable to regression.
Possible Outcomes IIB • Relationship between independent variable and dependent variable is slightly changed and remains consistent across categories of control. • Both IV and the 3rd variable are related to DV. • What to do: Consider including IV and 3rd variable in future analyses. • Might consider running separate regressions for each category of 3rd variable if you are very interested in that relationship. • Probably no reason to do anything special.
Possible Outcomes - III • When you add a third variable… • Relationship between independent and dependent variables virtually disappears. • Independent variable is not related to dependent variable OR • There is a sequence: independent variable affects third variable which affects DV. • Recall example: Race, income and the vote in the US • New variable replaces IV in the regression.
Possible Outcomes IV • Relationship between independent and dependent variables changes (Specification) BUT • New variable is not related to dependent variable. • What to do: • Run separate regressions for each level of new variable (only works when new variable has few categories – like Francophobes/Anglophones). • Add new variables to regression and create interaction term between new variable and IV.
Specification • Z specifies relationship of x and y. • Example: when z=1, x has a strong, positive relationship with y, but when z=0, x has a weak, negative relationship with y.’
Interaction • Interaction term = Z * X • Example, if X = Education, Z = Female (1) • IVs: • X (weak / insignificant) • Z (insignificant) • Z * X (strong, significant)
Possible Outcomes V • Relationship between independent and dependent variables changes “markedly” like when relationship between IV and DV changes sign across categories of control variable. • The relationship is interactive; the control variable specifies the relationship between DV and IV. • What to do: • Include IV & new variable in all future analyses. • Add variable and interaction term
Interaction • Treat Z as another independent variable, X2. • X1 and X2 do not have an additive effect on Y. Form is not Y=a+bX1+bX2 • Relationship is interactive. Y=a+bX1+bX2+b(X1*X2)
Interaction Terms • Example: • X1= Attitude towards abortion • Y= Opinion towards feminists • X2= Political Knowledge • In the U.S., those with high levels of knowledge equate feminism and feminists with pro-choice stances. Relationship is much weaker at low levels of political knowledge. • So, we need to interact political knowledge with attitudes towards abortion to best explain attitudes towards • OpinionFeminists=AttitudeAbortion+PolKnowledge+PolKnowledge*AttitudeAbortion • Note: you always include the “direct” effect of both interaction terms in equation too!
Problems and Opportunities • You can interact more than two variables. • Interaction can be Interval/Ordinal*Interval/Ordinal OR Interval/Ordinal*Dummy OR Dummy*Dummy • But every time you run an interaction, you risk multicollinearity since the interaction term is necessarily related to direct effects of the variables that are interacting.
Tricky interpretation • “Direct” effect = effect of X1 is when X2 is zero and vice versa.
Example – Gender & Language • Three dummy variables: • Gender (1=Women, 0=Men) • Language (1=French, 0=English) • Gender*Language (Interaction) • Interpret direct effect of Gender as effect of English speaking women compared to English speaking men. • Since 0=English and 0=Men, reference category is always English speaking men. • Interpret direct effect of Language as effect of French speaking men compared to English speaking men. • Interaction is understood as effect of French speaking women compared to English speaking men.
Example – Age & Religiosity • Three variables: • Age (ordinal, young->old recoded into cohort groups) • Religiosity (ordinal, high=regular church-goer) • Gender*Language (Interaction) • Interpret direct effect of Age as effect of increasing age for non-religious people. • Reference category is always non-religious young. • Interpret direct effect of Religiosity as effect of religion on youngest group. • Interaction is understood as effect of increasing both Age and Religiosity, in other words, what is effect of older, religious people compared to non-religious young.
Another possible option • When one variable is dichotomous it is often easier to just run separate regressions for each category of the control variable. • So, one regression for francophones, and one for anglophones. Or one for men, and one for women…
To – Do: • Lab 7 – but can also be done with correlations (for interval level data or ordinal data with many categories) • Foundation for worksheet • Lab 9B – Interactions • Put an interaction variable in the equation OR • Run multiple regressions on different parts of the data
Announcements • Turnitin.com; 2653464 Pwd = Tables • Thursday: 2653473, Pwd = spring • Quiz results • Next week may be a little different than what is on the syllabus • Encouraged to speak to me and the TAs about papers OR whether you are best off taking the test.