Introduction to Modeling 101
300 likes | 413 Vues
Learn about travel demand models, mathematical equations to estimate person/vehicular travel choices. Explore internal work trips, bicycle usage, pedestrian distances, parking, VMT reduction, and modal changes due to transit improvements.

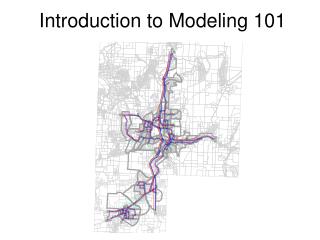
Introduction to Modeling 101
E N D
Presentation Transcript
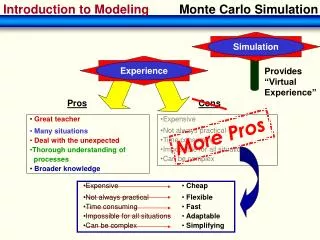
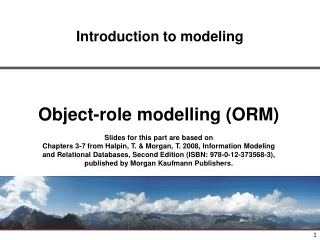
WHAT ARE TRAVEL DEMAND MODELS ? In Transportation Planning we use the term ‘models’ extensively. This term, as we use it, loosely refers to a set of mathematical equations used to represent choices made when people travel and ultimately estimate person/vehicular travel. http://www.uwm.edu/Dept/CUTS/primer.htm
"I only want to look at internal work trips!" "can you model person trips?" "how many work trips are by bicycle?" "how far do people walk to catch the bus?" "why VMT?" "what about parking, is it considered?" "how do we reduce VMT?" "we improved congestion but now the emissions and VMT are higher!" "can you reflect modal changes resulting from transit improvements?"
Why Do Modeling • Enables planners to handle large amounts of data • Enables more sophisticated analysis than other methods • Allows for testing of “what-ifs” about an unlimited number of scenarios • Enables a true multi-modal efforts
Why Now? • New jurisdictions in MPO (Talent, Ashland, Jacksonville & Eagle Point) • New update of Regional Transportation Plan (RTP) • More attention to land use and density possibilities • All the work is refinements of former model
Benefits to Modeling • Essential for system wide analysis • Provides travel forecast based on anticipated land use • At the appropriate level, can help avoid legal challenges • Can test a large number of scenarios (land use and network) in a short amount of time • Sensitivity testing • Cost effective when compared to the alternatives • Produces consistent comparable outputs by-product: large inventory of local/regional data
HBW Household Demographics Land Use Data HBSC Submodels Income, Worker, HH Size HBSH HBO Peak Hour Factor(s) Trip Rates NHB Trip Generation (internal trips)
Trip Generation Two person, Two worker HH $35K Five person, Three worker HH $50K+ One person, One worker HH <$25K Daily Trips Work 1.47 Shop 0.41 Rec 0.50 Other 0.54 Non Home 1.00 3.92 Daily Trips Work 2.52 Shop 0.72 Rec 0.63 Other 1.19 Non Home 2.45 7.51 Daily Trips Work 4.04 Shop 1.64 Rec 2.35 Other 3.65 Non Home 4.87 16.55
HBW Household Demographics Land Use Data HBSC HBW HBW Submodels Income, Worker, HH Size HBSH Production Attraction HBSC HBSC HBO Peak Hour Factor(s) Production Attraction Trip Rates HBSH HBSH NHB Trip Generation (internal trips) Production Attraction HBO HBO Production Attraction NHB NHB Utility HBW Utility HBSC HBSH Utility HBO Utility NHB Utility Production Attraction Trip Distribution
j i 4 min In Central Business District 7 min 2 min Typical shopping trip distribution j j eUij Pij = SI eUij Uij = b1ij+b2ij2+b3ij3+bBrdg+bCBD+ln(land use) Travel Time
But First Let’s Role the Dice
Probability of rolling a 3 with a single die is: P(3)= P(3) P(1)+P(2)+P(3)+P(4)+P(5)+P(6) or 1/6 = 0.167 equal chance for all rolls
In simple terms, we are just weighting the dice with local data eUij Pa = SI eUij
Trip distribution is the process by which trips originating in one zone are distributed to the other zones in the study area. That is, each zone’s trip productions are connected to all the zones to which they are attracted.
HBW Household Demographics Land Use Data HBSC HBW HBW Submodels Income, Worker, HH Size HBSH Production Attraction HBSC HBSC HBO Peak Hour Factor(s) Production Attraction Trip Rates HBSH HBSH NHB Trip Generation (internal trips) Production Attraction HBO HBO Production Attraction NHB NHB Utility HBW Utility HBSC HBSH Utility HBO Utility NHB Utility Production Attraction Trip Distribution HBW Utility Other Modes External Trip Model Yes Utility HBNW NHB Utility Mode Choice
Mode Choice eUi Pa = SI eUi
HBW Household Demographics Land Use Data HBSC HBW HBW Submodels Income, Worker, HH Size HBSH Production Attraction HBSC HBSC HBO Peak Hour Factor(s) Production Attraction Trip Rates HBSH HBSH NHB Trip Generation (internal trips) Production Attraction HBO HBO Production Attraction NHB NHB Utility HBW Utility HBSC HBSH Utility HBO Utility NHB Utility Production Attraction External Trip Model Trip Distribution No HBW Utility Other Modes Vehicle Occupancy External Trip Yes Utility Distribution HBNW Model NHB Utility Mode Choice Diurnal Factoring Optimize Travel Time Feed Back Trip Assignment
Vehicle Route Choice V0= 0 V1=100 Route 1 T0 = 6.4 min T1= 6.4 min V0=1,000 V1=650 T0= 6.0 min Route 2 T1=6.3 min Zone B Zone A V0=0 V1= 250 Route 3 T0=6.45 min T1= 6.5 min Assuming a Lane Capacity of 1,000 Vehicles/Hour
Reality GIS Integrates All the Parts…to See the Whole! Homes Zoning Streets Census Block Groups Cities Limits Soil Type
Where are people and where do they need/want to go? Transportation analysis zones (TAZs) represent spatial aggregations of activity locations.
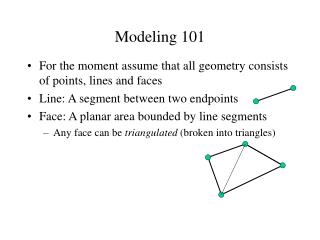
How do people get to where they are going? The transportation network provides connections between activity locations.
How do people get to where they are going? The transportation network consists of nodes connected by links to represent the street system.
Rich Arnold 503-986-4218 richard.arnold@state.or.us Sam Ayash 503-986-4101 sam.h.ayash@odot.state.or.us For More Information Additional documentation and information can be viewed on Oregon’s website @: http://www.odot.state.or.us/tddtpau/modeling.html