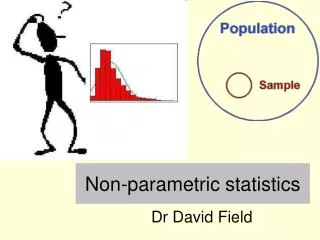
Non-parametric tests, part A:
Non-parametric tests, part A:. Two types of statistical test: Parametric tests: Based on assumption that the data have certain characteristics or "parameters": Results are only valid if (a) the data are normally distributed; (b) the data show homogeneity of variance;

Non-parametric tests, part A:
E N D
Presentation Transcript
Two types of statistical test: Parametric tests: Based on assumption that the data have certain characteristics or "parameters": Results are only valid if (a) the data are normally distributed; (b) the data show homogeneity of variance; (c) the data are measurements on an interval or ratio scale. group 1: M = 8.19 (SD= 1.33), group 2: M = 11.46 (SD = 9.18)
Nonparametric tests: Make no assumptions about the data's characteristics. Use if any of the three properties below are true: (a) the data are not normally distributed (e.g. skewed); (b) the data show inhomogeneity of variance; (c) the data are measured on an ordinal scale (ranks).
Examples of parametric tests and their non-parametric equivalents: Parametric test:Non-parametric counterpart: Pearson correlation Spearman's correlation (No equivalent test) Chi-Square test Independent-means t-test Mann-Whitney test Dependent-means t-test Wilcoxon test One-way Independent Measures Analysis of Variance (ANOVA) Kruskal-Wallis test One-way Repeated-Measures ANOVA Friedman's test
Non-parametric tests for comparing two groups or conditions: (a) The Mann-Whitney test: Used when you have two conditions, each performed by a separate group of subjects. Each subject produces one score. Tests whether there is a statistically significant difference between the two groups.
Mann-Whitney test, step-by-step: Does it make any difference to students' comprehension of statistics whether the lectures are in English or in Serbo-Croat? Group 1: statistics lectures in English. Group 2: statistics lectures in Serbo-Croat. DV: lecturer intelligibility ratings by students (0 = "unintelligible", 100 = "highly intelligible"). Ratings - so Mann-Whitney is appropriate.
Step 1: Rank all the scores together, regardless of group.
Revision of how to Rank scores: • Same method as for Spearman's correlation. • (a) Lowest score gets rank of “1”; next lowest gets “2”; and so on. • (b) Two or more scores with the same value are “tied”. • (i) Give each tied score the rank it would have had, had it been different from the other scores. • (ii) Add the ranks for the tied scores, and divide by the number of tied scores. Each of the ties gets this average rank. • (iii) The next score after the set of ties gets the rank it would have obtained, had there been no tied scores. • e.g. raw score: 6 34 34 48 • “original” rank: 1 23 4 • “actual” rank: 1 2.5 2.5 4
Step 2: Add up the ranks for group 1, to get T1. Here, T1 = 83. Add up the ranks for group 2, to get T2. Here, T2 = 70. Step 3: N1 is the number of subjects in group 1; N2 is the number of subjects in group 2. Here, N1 = 8 and N2 = 9. Step 4: Call the larger of these two rank totals Tx. Here, Tx = 83. Nx is the number of subjects in this group. Here, Nx = 8.
Step 5: • Find U: • Nx (Nx + 1) • U = N1 * N2 + ---------------- - Tx • 2 • In our example, • 8 * (8 + 1) • U = 8 * 9 + ---------------- - 83 • 2 • U = 72 + 36 - 83 = 25
If there are unequal numbers of subjects - as in the present case - calculate U for both rank totals and then use the smaller U. In the present example, for T1, U = 25, and for T2, U = 47. Therefore, use 25 as U. Step 6: Look up the critical value of U, (e.g. with the table on my website), taking into account N1 and N2. If our obtained U is equal to or smallerthan the critical value of U, we reject the null hypothesis and conclude that our two groups do differ significantly.
Here, the critical value of U for N1 = 8 and N2 = 9 is 15. Our obtained U of 25 is larger than this, and so we conclude that there is no significant difference between our two groups. Conclusion: ratings of lecturer intelligibility are unaffected by whether the lectures are given in English or in Serbo-Croat.
(b) The Wilcoxon test: Used when you have two conditions, both performed by the same subjects. Each subject produces two scores, one for each condition. Tests whether there is a statistically significant difference between the two conditions.
Wilcoxon test, step-by-step: Does background music affect the mood of factory workers? Eight workers: each tested twice. Condition A: background music. Condition B: silence. DV: workers’ mood rating (0 = "extremely miserable", 100 = "euphoric"). Ratings, so use Wilcoxon test.
Step 1: Find the difference between each pair of scores, keeping track of the sign of the difference. Step 2: Rank the differences, ignoring their sign. Lowest = 1. Tied scores dealt with as before. Ignore zero difference-scores.
Step 3: Add together the positive-signed ranks. = 22. Add together the negative-signed ranks. = 6. Step 4: "W" is the smaller sum of ranks; W = 6. N is the number of differences, omitting zero differences. N = 8 - 1 = 7. Step 5: Use table (e.g. on my website) to find the critical value of W, for your N. Your obtained W has to be equal to or smaller than this critical value, for it to be statistically significant.
The critical value of W (for an N of 7) is 2. Our obtained W of 6 is bigger than this. Our two conditions are not significantly different. Conclusion: workers' mood appears to be unaffected by presence or absence of background music.