Download
1 / 24
360 likes | 680 Vues
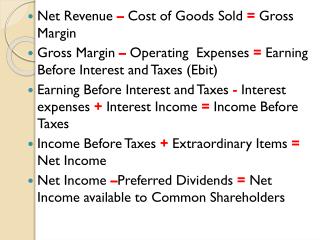
Inventories and the Cost of Goods Sold. Chapter 8. BALANCE SHEET. Asset. Inventory. INCOME STATEMENT. Revenue. Cost of goods sold. Gross profit. Expenses. Net income. The Flow of Inventory Costs. Purchase costs (or manufacturing costs). as goods are sold.

E N D
Inventories and the Cost of Goods Sold Chapter 8
BALANCE SHEET Asset Inventory INCOME STATEMENT Revenue Cost of goods sold Gross profit Expenses Net income The Flow of Inventory Costs Purchase costs (or manufacturing costs) as goods are sold
Which Unit Did We Sell? When identical units of inventory have different unit costs, a question naturally arises as to which of these costs should be used in recording a sale of inventory.
Data for an Illustration The Bike Company (TBC)
Specific Identification On August 14, TBC sold 20 bikes for $130 each. Of the bikes sold 9 originally cost $91 and11 cost $106. The Cost of Goods Sold for the August 14 sale is $1,985. This leaves 5 units, with a total cost of $515, in inventory: 1 unit that costs $91 and 4 units that cost $106 each.
Average-Cost Method Additional purchases were made on August 17 and August 28. On August 31, an additional 23 units were sold. $114 = $3,990 35
First-In, First-Out Method (FIFO) On August 14, TBC sold 20 bikes for $130 each. The Cost of Goods Sold for the August 14 sale is $1,970, leaving 5 units, with a total cost of $530, in inventory.
Last-In, First-Out Method (LIFO) On August 14, TBC sold 20 bikes for $130 each. The Cost of Goods Sold for the August 14 sale is $2,045, leaving 5 units, with a total cost of $455, in inventory.
Taking a Physical Inventory The primary reason for taking a physical inventory is to adjust the perpetual inventory records for unrecorded shrinkage losses, such as theft, spoilage, or breakage.
LCM and Other Write-Downsof Inventory Reduces the value of the inventory. Obsolescence Lower of Cost or Market (LCM) Adjust inventory value to the lower of historical cost or current replacement cost (market).
Periodic Inventory Systems In a periodic inventory system, inventory entries are as follows. Note that an entry is not made to inventory.
Cost of Goods Sold $9,725 - $6,400 = $3,325 Specific Identification
Average-Cost Method Avg. Cost $9,725 1,800 = $5.40278 Ending Inventory Avg. Cost $5.40278 1,200 = $6,483 Cost of Goods Sold Avg. Cost $5.40278 600 = $3,242
The Gross Profit Method • Determine cost of goods available for sale. • Estimate cost of goods sold by multiplying the net sales by the cost ratio. • Deduct cost of goods sold from cost of goods available for sale to determine ending inventory.
× 70% The Gross Profit Method Step 1 Step 2 Step 3
The Retail Method Matrix would follow the steps below to estimate their ending inventory using the retail method.
Financial Analysis (Beginning Inventory + Ending Inventory) ÷ 2