Pooling Strategy for Analyzing Sample Variations in Detector and Scout Pools
10 likes | 131 Vues
This figure illustrates the pooling strategy utilized in the analysis of sample variations. Sixteen detector pools (P1-P16, shown in yellow) were created from five distinct samples. Subsequently, five scout pools (P17s-P21s, shown in green) were formed, each containing one sample from the corresponding detector pools. The detector pools proved instrumental in accurately analyzing the data and identifying variations, while the scout pools facilitated the assignment of each variation to its specific sample, ensuring comprehensive analysis and insights into the data set.

Pooling Strategy for Analyzing Sample Variations in Detector and Scout Pools
E N D
Presentation Transcript
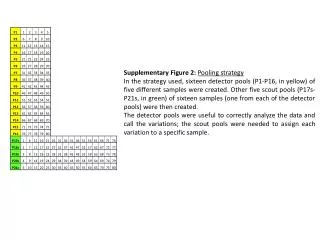
Supplementary Figure 2: Pooling strategy In the strategy used, sixteen detector pools (P1-P16, in yellow) of five different samples were created. Other five scout pools (P17s-P21s, in green) of sixteen samples (one from each of the detector pools) were then created. The detector pools were useful to correctly analyze the data and call the variations; the scout pools were needed to assign each variation to a specific sample.