Download
1 / 20
200 likes | 541 Vues
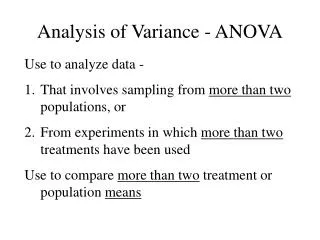
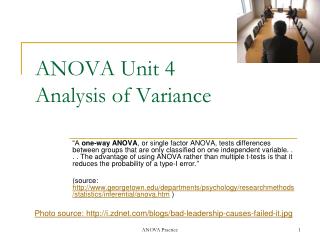
ANOVA Unit 4 Analysis of Variance. “A one-way ANOVA , or single factor ANOVA, tests differences between groups that are only classified on one independent variable. . . . The advantage of using ANOVA rather than multiple t-tests is that it reduces the probability of a type-I error.”

E N D
ANOVA Unit 4 Analysis of Variance “A one-way ANOVA, or single factor ANOVA, tests differences between groups that are only classified on one independent variable. . . . The advantage of using ANOVA rather than multiple t-tests is that it reduces the probability of a type-I error.” (source: http://www.georgetown.edu/departments/psychology/researchmethods/statistics/inferential/anova.htm ) Photo source: http://i.zdnet.com/blogs/bad-leadership-causes-failed-it.jpg ANOVA Practice
Remember what we said about error? • LESS SERIOUS: A type I error occurs when the null hypothesis is rejected when it is in fact true; that is, H0 is wrongly rejected. • MORE SERIOUS: Type II error occurs when the null hypothesis H0, is not rejected when it is in fact false. • A type II error is frequently due to sample sizes being too small. ANOVA Practice
Unit or Week 4 Practitioner's WorkScenario 1Step 1: Take this motivation to lead test: http://www.mindtools.com/pages/article/newLDR_01.htmDetermine your score:14 – 27This implies a low motivation to lead28 - 55This implies some uncertainty over your motivation to lead56 - 70This implies a strong motivation to lead • Now you are familiar with the test we will use for the hypothetical example. ANOVA Practice
Step 2: Calculate the problem using an ANOVA comparing groups using an appropriate program. • Explore: ANOVA:http://www.openepi.com/Menu/OpenEpiMenu.htm • Research question: Is there a difference among students of different majors in their leadership motivation. • Operational definition: Leadership motivation is the score motivation to lead others according to the score on Mind Tools Leadership Motivation Assessment Measure. ANOVA Practice
Scenario 1: Imagine that we have four groups. • Group A: A random sample group of first year communication majors take the Motivation to Lead test. • Group C: A random sample group of communication majors who graduated from Park University take the Motivation to Lead test. • Group D: A random sample group of communication and leadership MA graduate program majors who graduated from Park University take the Motivation to Lead test. ANOVA Practice
Here are the scores for each group: • A B C 61 57 66 58 58 67 59 60 69 60 57 68 61 58 67 58 55 61 60 58 58 61 60 59 ANOVA Practice
Step 2 • Calculate the problem using an ANOVA comparing groups. • You can use an online calculator (Internet), Microsoft Office Excel, or SPSS. ANOVA Practice
Here is an example ANOVA calculator. ANOVA Practice
Results, then check table. ANOVA Practice
Answer is -10.5, which is below significance level indicated on this chart. ANOVA Practice
You can use SPSS and open data file from Excel ANOVA Practice
Open Excel and Enter Data ANOVA Practice
You can calculate an ANOVA—also called “F test”--in Excel if you have a version that provides ANOVA calculation. • Enter data into data table. • Depending on your version, go to TOOLS > DATA ANALYSIS • Select “ANOVA single” • Enter input range—this will be all of your data (you can simply draw a box around your data table) • Alpha is preset at .05. • Set output—where do you want your data to go? It can either go on the same sheet, on a different sheet, or in a whole new workbook. • Hit “OK” ANOVA Practice
Compare Means - ANOVA • Dependent variables are the two post tests. ANOVA Practice
Select .05 level significance. ANOVA Practice
There doesn’t seem to be any difference among majors regarding their leadership motivation. • Remember, this is fictional data in a fictional study, just to provide an example. • That’s all for this practice session. I sincerely appreciate your effort in this course! ANOVA Practice