Spatial Prediction from Point Samples: An Insight into Geostatistical Methods
This review explores recent lectures on spatial prediction from point samples, highlighting key concepts in geostatistics, including population sampling, variograms, and trend surfaces. The material discusses foundational statistics involving descriptive and inferential techniques, and how geostatistical methods enhance map accuracy. By utilizing empirical variograms and spatial covariance models, the lectures provide insight into predicting values at unsampled points based on existing data. A focus on both regional and local processes illustrates the complexity and utility of spatial analysis in various scientific fields.


Spatial Prediction from Point Samples: An Insight into Geostatistical Methods
E N D
Presentation Transcript
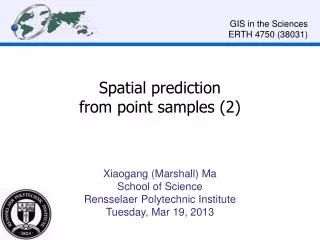
GIS in the Sciences ERTH 4750 (38031) Spatial prediction from point samples (1) Xiaogang (Marshall) Ma School of Science Rensselaer Polytechnic Institute Tuesday, Mar 05, 2013
Review of recent lectures (1) • Population: a set of well-defined objects; • Sample: a subset of a population • Statistics: descriptive (numerical summaries of samples) & inferential (from samples to populations) • Geostatistics: statistics on a population with known location • Feature space: variables represent attributes • Geographic space: variables represent geographic coordinates • Geostatistical computing: • Visualization: patterns in geographic and feature space • Computation: large numerical systems that are hard to solve by hand • R
Review of recent lectures (2) • Spatial structure: scatterplot, postplot, quantile plot, classified postplot, etc. • Regional trend: the feature space value of the variable changes systematically with the geographic space coordinates • Trend surface: first-order, second-order, higher-order • Looking for a trend in the post-plot • Point-pairs, h-scatterplots • Semivariance, variogram clouds, empirical variograms • Sill, range and nugget in an empirical variogram • Anisotropy, isotropy, variogram surfaces, directional variograms
Review of recent lectures (3) • Fit trend surfaces • Regional spatial process: operates over an entire region • Local spatial process: operates over some neighborhood • Trend surface: the most common regional model • Evaluating a trend surface fit: • Numerical measures: Adjusted , Residuals • Graphical method: “1:1” plots, diagnostic plots of residuals
Random fields • The observed attribute values are only one of many possible realizations of a spatially auto-correlated random process • Regionalized variable: the set of values of the random variable in the spatial field • First-order stationarity: assume that the expected values at all locations in the field are the same • Second-order stationarity at one point: assume that the variance is the same finite value at all points • Second-order stationarityover the spatial field: assume that the covariance between points depends only on their separation (and not on their actual location or individuality) • Go from the experimental variogram to a variogram model in order to be able to model the random process at any separation
Models of spatial covariance • Authorized models: • Group 0: Pure nugget (no spatial structure) • Group 1: Unbounded models • Group 2a: Bounded models: Bounded linear, Spherical, Circular, Pentaspherical • Group 2b: Bounded asymptotic models: Exponential, Gaussian • Variogram analysis; variogram model fitting • By eye; Automatically; Mixed
Acknowledgements • This lecture is partly based on: • Rossiter, D.G., 2012. Spatial prediction from point samples (1). Lecture in distance course Applied Geostatistics. ITC, University of Twente
Contents • A taxonomy of spatial prediction methods • Non-geostatisticalprediction • Introduction to Ordinary Kriging The derivation of the kriging equations is deferred to the next lecture
Spatial prediction from point samples is one of the main practical applications of geostatistics– we know the value of some attribute at some observation points, but we need to know it over an entire area – i.e. we want to mapit. • Prior to the introduction of sound geostatistical methods, contourmaps were drawn by hand, using the intuition / local knowledge of the mapper. These maps are often beautiful, but how realistic are they? With geostatistical methods we have a firm basis for both predictionand assessing the quality of the result.
1 A taxonomy of spatial prediction methods • Objective: to predict the value of some attribute at an unsampled point based on the values of that attribute at sampled points. • Prediction can be at: • Selected points of particular interest; • All points on a grid; the result is a map of the spatial field at the grid resolution • In both cases the predictions can be of: • the pointsthemselves, always with some specified support ; • average values in blocks centered on points.
Interpolation vs. Extrapolation • Spatial prediction is often referred to as spatial interpolation, but strictly speaking: • Interpolation: prediction at points that are geographically inside the convex hull of the sample set; • Extrapolation: prediction at points outside this geographic area.
So, we want to predict at unsampled locations. But how do we do this? There are many methods; the only thing they all have in common is that they use the available data in some way. • Before entering into a detailed description of the most common methods, we first classify them into a taxonomy, based on how they use the available data.
A taxonomy of spatial prediction methods • Strata: divide area to be mapped into “homogeneous” strata; predict within each stratum from all samples in that stratum • Globalpredictors: use all samples to predict at all points; also called regional predictors • Localpredictors: use only “nearby” samples to predict at each point • Mixed predictors: some of structure is explained by strata or globally, the residuals from this are explained locally We will see examples of all of these.
The question that is always asked at this point is . . . Which method is best? • And the answer is, as for so many other things in the messy real world . . . It depends! • The key point is that we believe that there is some order in nature; there is some reason that the data values are as we observe them. We try to model this structure, then use this model to predict. If the model is correct, the prediction should be good.
Which prediction method is “best”? • There is no theoretical answer • Depends on how well the approach models the “true” spatial structure, and this is unknown (but we may have prior evidence) • The method should correspond with what we know about the process that created the spatial structure
Which prediction method is “best”? (continued) • Check against an independent validation dataset • Mean squared error (“precision”) of prediction vs. actual (residuals) • Bias (“accuracy”) of predicted vs. actual mean • With large datasets, model with one part and hold out the rest for validation • Cross-validationfor small datasets with a modeled structure Various cross-validation methods: http://en.wikipedia.org/wiki/Cross-validation_(statistics) We will see how to measure these later.
Approaches to prediction (1): Strata • Not really spatial analysis, since spatial position is not used, but it does predict in space. • Example: Nutrient content in a eld, since elds are treated as units in management • Stratifythe landscape (e.g. by land use, geological formation . . . ) It is common to use an existing class map to identify the strata. • Sample within strata according to non-spatial sampling theory • Analyzewith non-spatial techniques, e.g. ANOVA • Each location in stratum has the same expected value and variance, based on the sample from that stratum
This is also called design-based prediction, which is opposed to geostatistical or model-basedprediction, since there is no model of spatial dependence. • The “design” refers to the probability sampling design which is necessary to get correct inferences.
Other approaches to spatial prediction do consider the spatial location of the sample and prediction points. • We begin with a prediction method that uses all sample points to calibrate a model of regional trend, which is then used to predict at unsampled points.
Approaches to prediction (2): Global (Regional) Predictors • These are also called trend surfaces • The derivation of their mathematical form was covered in a previous lecture; recall that the general polynomial trend surface of order is: • The trend surface formula is a function of the coordinates; for every location as coordinates we can predict from the formula.
Prediction with a trend surface White points are observations, everywhere else is predictions
Approaches to prediction (3): Local predictors • No strata • No regional trend • Value of the attribute is predicted from “nearby” samples • Example: concentrations of soil constituents (e.g. salts, pollutants) • Example: vegetation density • Example: house price
Local predictors: Model-based or not? • A predictor is called model-based or geostatistical if it requires a model of spatial structure. • The most common is some form of kriging; the geostatistical basis is the variogrammodel • Otherwise it is based on untestable assumptions about spatial dependence • An example is inverse-distance weighted average.
We've seen stratified, regional and local predictors; these correspond to three classes of processes. • Of course, nature is never so simple! An attribute may owe its spatial distribution to a combination of processes; we then need a mixed predictor that somehow combines the predictor types.
Approaches to prediction (4): Mixed predictors • For situations where there is both long-range structure (trend) or strata andlocal structure • Example: Particle size in the soil: strata (rock type), trend (distance from a river), and local variation in depositional or weathering processes • One approach: model strata or global trend, subtract from each value, then model residuals! e.g. Regression Kriging. • Another approach: model everything together! e.g. Universal Kriging or Kriging with External Drift
2 Non-geostatistical prediction • Before looking at so-called “optimal” weighting (i.e. kriging) we examine various non-geostatistical prediction methods. • These were widely-used before kriging was developed, and still are in some circumstances. • The advantage of these methods, compared to kriging, is that no model of spatial dependenceis required; there is no need to compute or model variograms. • One disadvantage is that there is no theory behind them, only assumptions. • The major disadvantage is that they are often based on invalid assumptions, in particular spatial independence of the samples. So, the prediction may be incorrect even in the expected value.
Non-geostatistical stratified predictors • This was explained above; recall: • Stratifythe landscape into “homogeneous” units; this is often on the basis of an existing class map • Sample within strata according to non-spatial sampling theory; so each observation is identified with one stratum • Each location to be predicted is in some stratum; it has the same expected value and variance, based on the observations from that stratum • No information from any other stratum is used, except that the variance may be pooled • The geographic locations of the prediction and observation points are irrelevant
The following page shows a stratificationof the Meuse floodplain by the three flood frequency classes, and then the predicted value at each point, based on the observations from that class: • Note that there is no variability of the predictions within a stratum. This is the best we can do with design-basedmethods. • Also, there is no spatial dependence; the computed means and variances assume this. This assumption is rarely met! which is why this method is rarely valid.
Non-geostatistical Local Predictors • Nearest neighbor (Thiessen polygons) • Average within a radius • Average of the nearest neighbors • Distance-weighted average within a radius • Distance-weighted average of nearest neighbors These all have an implicit model of spatial structure; but they are assumptions which can not be tested.
Local predictor (1): Nearest neighbor (Thiessen polygons) • Also known as a Voronoi mosaic, computed by a Delaunay triangulation • Predict each point from its single nearest sample point • Assumption: process is the same within each polygon and changes abruptly at the borders • Conceptually-simple, makes the minimal assumptions about spatial structure • No way to estimate variance of the prediction error • Ignores other “nearby” information • Maps show abrupt discontinuities at boundaries, so don't look very realistic • But may be a more accurate predictor than poorly-modeled predictors
Nearest neighbors The Thiessen polygons for the Jura soil sample data set (259 calibration points). Each point within a polygon is predicted by the value of the nearest point, i.e. the point within the polygon. These are shown as a postplot proportional to the lead content. (Figure produced with the tripackpackage of the R environment for statistical computing.)
Local predictor (2): Average within a radius • Use the set of all neighboring sample points within some radius • Predict by averaging : • Assumption: process is the same within the circle, but there is random variation due to a noisy process • This can't be true of overlapping circles! • Although we can calculate variances from the neighbors, these assume no spatial structure closer than the radius • Problem: How do we select a radius?
Local predictors (3): Distance-weighted average • Inverse of distance of the point to be predicted to some set of nearest-neighbors, to some power • : “inverse distance”, : “inverse distance squared”, etc. • Assumption: process is a power model where the spatial correlation depends inversely on distance • This is like kriging with a power variogram model -- except the spatial dependence amongthe neighbors (known points) is not accounted for! • Can select all points within some limiting distance (radius), or some fixed number of nearest points, or . . . so, how to select radius or number and power objectively?
Inverse distance vs. Ordinary Kriging • In the following slide we compare inverse distance (linear) to Ordinary Kriging (OK) with a spherical model (range = 1150 m), to predict the base-10 log Cd concentration in soils in the Meuse river floodplain in the southern NL.
OK gives a smoother map; • Inverse distance shows small “islands” or “spots”; the size of these is controlled by the power to which the inverse distance is raised. • The “spots” are controlled by the observation points.
3 Ordinary kriging • The theory of regionalized variables leads to an “optimal” prediction method, in the sense that the kriging variance is minimized. • This is based on the theory of random fields which was presented in a previous lecture.
Optimal local interpolation: motivation • Problems with Theissen polygons: • Abrupt changes at boundaries are an artifact of the sample spatial distribution • Only uses one sample point for each prediction; inecient use of information • Problems with average-in-circle methods: • No objective way to select radius of circle or number of points • Obviously false underlying assumption • Problems with inverse-distance methods: • How to choose power (inverse, inverse squared . . . )? • How to choose limiting radius? • In all cases: • uneven distribution of samples: over{ or under{emphasize some sample areas • kriging variance must be estimated from a separate validation dataset
These deficiencies in existing local interpolations were well-known. • The aim was to develop a linear predictor as a weighted average of the observations, with an objectively optimalmethod of assigning the weights. • The theory for this developed several times (Kolmogorov 1930's, Wiener 1949) but current practice dates back to Matheron (1963), formalizing the practical work of the mining engineer D G Krige (RSA). • In Krige'shonor these methods are called kriging (now with a small “k”); it should really be written as “krigeing” (French krigeage) but it's too late for that. Matheron Krige
Introduction to Ordinary Kriging (OK) • In what sense is OK “optimal”? • Derivation of the OK system of equations • Interpolation by kriging
An “optimal” local predictor would have these features: • Prediction is made as a linear combination of known data values (a weighted average). • Prediction is unbiased and exact at known points • The prediction variance should be as small as possible.
Implications • Satisfying the above will bring some important benefitsover non-geostatistical predictors: • Points closer to the point to be predicted have larger weights, according to the modeled spatial dependence • Clustersof points “reduce to” single equivalent points, i.e., over-sampling in a small area can't bias result • automatically de-clusters • Closer sample points “mask” further ones in the same direction • Intuitively, the masked point gives no useful information • Error estimate is based only on the spatial configuration of the sample, not the data values
Kriging • A “Best Linear Unbiased Predictor” (BLUP) that satisfies a certain optimality criterion (so it's “best” with respect to the criterion) • It is only “optimal” with respect to the chosen model and the chosen optimality criterion • Based on the theory of random processes, with covariances depending only on separation (i.e. a variogram model)
What is so special about kriging? • Predicts at any point as the weighted average of the values at sampled points • as for inverse distance (to a power) • Weights given to each sample point are optimal, given the spatial covariance structure as revealed by the variogram model (in this sense it is “best”) • Spatial structure between known points, as well as between known points and each prediction point, is accounted for. • So, the prediction is only as good as the model of spatial structure. • The kriging variance at each point is automatically generated as part of the process of computing the weights. • because this variance is used as an optimality criterion, it must be computed during the kriging process, and can be saved along with the BLUP.
How do we use Kriging in practice? • Sample, preferably at different resolutions • Calculate the experimental variogram • Modelthe variogram with one or more authorized functions • Applythe kriging system of equations, with the variogram model of spatial dependence, at each point to be predicted • Predictions are often at each point on a regular grid (e.g. a raster map) • These “points” are actually blocks of the size of the sampling support • Can also predict in blocks larger than the original support • As part of the solution of the kriging system, calculate the variance of each prediction; this is based only on the sample point locations, not their data values. • Displaymaps of both the predictions and their variances.
Prediction with Ordinary Kriging (OK) • The most common form of kriging is usually called “Ordinary”. In OK, we model the value of variable at location as the sum of: • a regional mean and • a spatially-correlated random component . • The regional mean is estimated from the sample, but not as the simple average, because there is spatial dependence. It is implicit in the OK system. This mean is constantacross the field, i.e. the expected value is the same and unknown; this is the “Ordinary” situation. • The spatially-correlated random component is estimated from the spatial covariance structure as revealed by the variogram model.
Ordinary Kriging (OK) • The estimated value at a point is predicted as the weighted average of the values at all sample points : • The weightsassigned to the sample points sum to 1: • Therefore, the prediction is unbiased with respect to the underlying random function :
What makes it “Ordinary” Kriging? • The expected value (mean) is unknown, and must be estimated from the sample • If the mean is known we have Simple Kriging (SK) • We will see this in Regression Kriging (known mean of residuals is zero) • There is no regional trend • If so we use Universal Kriging (UK) • There is no feature-space predictor, i.e. another attribute that helps explain the attribute of interest • If so we use Kriging with External Drift (KED) or Regression Kriging (RK)
We defer the derivation of the OK variance, and from that the kriging equations, to the next lecture. • The important point here is that the kriging equations minimize the kriging variance at each point to be predicted, so that OK is in that sense optimal, of course if the variogram model is correct.