Download
1 / 18
180 likes | 343 Vues
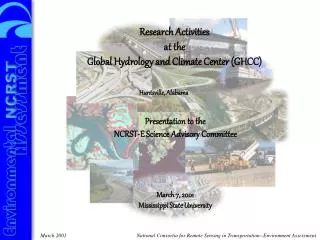
Research Activities at the Global Hydrology and Climate Center (GHCC). Huntsville, Alabama. Presentation to the NCRST-E Science Advisory Committee. March 7, 2001 Mississippi State University. What is the GHCC?.

E N D
Research Activitiesat theGlobal Hydrology and Climate Center (GHCC) Huntsville, Alabama Presentation to the NCRST-E Science Advisory Committee March 7, 2001 Mississippi State University
What is the GHCC? The Global Hydrology and Climate Center (GHCC) is a partnership among organizational elements from NASA’s Marshall Space Flight Center, the University of Alabama in Huntsville, and Universities Space Research Association. The primary focus of the Center is to understand the distribution and variability Earth’s water cycle at all scales, and the impact of human activity as it relates to climate and the environment. The GHCC brings together in one enterprise a community of about 180 scientists, engineers, and educators with a common focus on the global hydrologic cycle and its interaction with climate variation. The GHCC has a history of developing aircraft- and space-based remote sensing instruments, and expertise in development of remote sensing retrieval algorithms. The GHCC component of the NCRST-E is comprised of scientists from Universities Space Research Association (USRA), NASA, the University of Alabama in Huntsville (UAH), Auburn University, and East-West Enterprises, Inc. representing government, academic, non-profit and for-profit commercial businesses.
Year 1 and 2 Research Activities at GHCC 1.) Needs assessment: Continue efforts initiated in Year 1 to define the needs within the transportation industry for remotely sensed information. This effort is conducted in conjunction with other colleagues within the consortium. 2.) Regional-scale assessment of the environmental effects of transportation and urban development. 3.) Watershed-scale assessment of the environmental effects of transportation and urban development. 4.) Integration of multispectral/multiscale remote sensing data and enhanced feature extraction techniques.
Needs Assessment A needs assessment was initiated in Year 1 and will continue into the first part of Year 2 to define many issues that constrain, direct, and serve to focus our research. 1.) Define the organizational framework and regulatory process associated with transportation development, including NEPA requirements, the EIS process, major impediments. 2.) Define the institutional and political process by which highways are developed. What roles do federal and state transportation and environmental agencies play in planning, siting, design, construction, monitoring mitigation, etc. 3.) Define who the stakeholders are for remotely sensed data products. 3.) Define information needs of stakeholders and what the associated accuracy or variance requirements are for these data. 4.) Prioritize needs (may vary from state to state). 5.) Determine extent of utilization of current remote sensing technology. 6.) Define potential contributions of remote sensing immediately, in 5 yrs., in 10 yrs. 7.) What inertia exists in using an alternative data source? The needs assessment should produce the information needed to determine how best to “streamline” the highway development process.
Needs Assessment--Accomplishments 1.) We have acquired and read several EISs. 2.) We have met with several environmental professionals involved in developing EISs. 3.) Researched institutional structure, NEPA guidelines, regulatory legislation and Acts. 4.) Participated in the TRB conference in December, 2000. 5.) We have enlisted the assistance of the research staff at Research Triangle Institute, through cost sharing by NASA’s Marshall Space Flight Center, to assist with this task.
President Congress Council on Environmental Quality US DOT Nat’l Academy of Sciences Nat’l Academy of Engineering Federal Highway Administration (FHWA) Research & Special Programs Administration Nat’l Research Council Transportation Research Board (TRB) Ofc of Environ. Policy Ofc of Environment and Planning Ofc of Research, Technology, & Analysis Environmental Analysis and Environmental Operations Division Studies & Information Services (Division B) Cooperative Research Programs (Division D) Research & Tech. Coord. Committee (RTCC) Nat’l Coop. Highway Research Program (NCHRP) Environmental Research Program Numerous Research Panels Organizational Framework Organizational entities involved in transportation-related environmental research.
Federal Highway Administration (FHWA) State DOTs Regional Planning Commissions Metropolitan Planning Orgs. Municipal Planning Orgs. Municipal Engineering Offices Environmental Consulting Co. or Engineering Co. EIS Construction Contractor Programmatic Framework for Developing an EIS President Congress Executive Orders Legislation Regulations US Army Corp of Engineers US Fish and Wildlife Service US Environmental Protection Agency US Geological Survey US Forest Service Natural Resources Conservation Service Nature Conservancy Natural Heritage Foundation National Park Service etc. Data providers and agencies with regulatory control. Thus, these are stakeholders for our remote sensing applications.
Regional Scale Assessment Objective: To determine the effect transportation development over the past 25 years has had on the regional-scale environment, including land cover/land use change, runoff, streamflow, socio-economic variables, etc. Expected Outcome: We expect to gain valuable insight into the relationship between transportation development and long-term environmental changes and possibly even rates of change. Causal factors will not be defined. Study Area (outlined in red): includes 55 counties of the southern Appalachian region of northeastern Alabama, northwestern Georgia, and south-central Tennessee. This region includes the metropolitan regions of Atlanta, Birmingham, Chattanooga, and Huntsville. Chattanooga Huntsville Atlanta Birmingham
Regional Scale Assessment Accomplishments • Defined a 55-county study area in the southern Appalachian region. • Conducted a search for cloud-free Landsat images of the study area. • Acquired 31 Landsat Multispectral Scanner, Thematic Mapper, and Enhanced Thematic Mapper Plus images for complete coverage of the 55-county study area at four times since 1973. • Georectified, atmospherically corrected, and normalized Landsat images. • Acquired digital county transportation maps for most of the 55-county study area at multiple times since 1970. • Began developing a workflow to extract and attribute roads from digital maps to convert the maps to thematic information. • Selected six watersheds for general hydrologic study. • Acquired stream gage data from USGS stream gages throughout the study area. • Defined relevant hydrologic variables for analysis. • Initiated development of data base with selected socio-economic variables.
Watershed-scale Assessment Objective: To conduct a more detailed analysis of the relationship between transportation development and environmental variables at the watershed scale. Expected Outcome: This will provide a detailed understanding of the relationship between transportation development and hydrological and ecological changes at the watershed scale. MODIS Simulator Data Study Area: The area north of Atlanta, GA has been the focus of tremendous growth. The Sope watershed (yellow) has a long history of hydrologic and water quality data. The colored lines define boundaries for various multispectral/multiscale remotely sensed data sources acquired for the area. Sope Watershed Atlanta IFSAR Data ATLAS Data
Watershed-scale Assessment Accomplishments • ATLAS data acquired over Atlanta, GA on-hand--addressed calibration and signal to noise reduction in data. • Acquired Interferometric Synthetic Aperture Radar (IFSAR) data from Intermap Technologies Corp.’s STAR-3i sensor system for a portion of our study area. • Arranged to acquire high resolution (4 m) image data from EarthWatch Incorporated's Quickbird II sensor following deployment in 2001. • Evaluating land cover and land use classification techniques to be performed on high-resolution data. • Developing transportation history from digital transportation maps. • Defined relevant hydrologic variables for analysis. • Developed multi-decade database of population demographics, economic census data, and water quality data for the intensive-study watersheds. • Performed statistical analysis of hydrologic and water quality variables on intensive study sites. Identified • statistically significant trends in • these variables eliminated the • effect of any precipitation trends • in the data in order to isolate • effects associated with develop- • ment.
Improved Techniques for Deriving Information from Remote Sensing Objective: To develop technologies to integrate multispectral and multiscale remote sensing data from various data sources for enhanced feature extraction and classification. Rationale: Increases in spatial and radiometric resolution from new commercial remote sensing systems is outpacing the technology available to extract information from these data and has presented new challenges in image processing. New techniques are required to address the information needs of the transportation industry. Approach: Techniques will be developed and evaluated through demonstration projects and/or as a follow-up to a recently completed EIS activity. Expected Outcomes: This research seeks to develop and apply innovative tech-niques to exploit data from new remote sensing data sources to fill environmental assessment needs in the transportation industry. Pending the outcome of the needs assessment, we will focus efforts on several probable areas of research: a.) defining optimal scales for information extraction, b.) delineating environmentally sensitive areas, i.e., wetlands, areas of conservation concern, etc. c.) improved information extraction methods using fusion
Strategic Issues • 1.) Distribution of Effort--How do we divide our time among activities that contribute to streamlining, i.e., • deriving more accurate information • deriving information more rapidly • simplifying analysis techniques • providing assistance in acquiring data • providing data directories • etc. • 2.) Much emphasis has been placed on developing a product or and end-to-end solution as a metric of remote sensing potential. Initial case studies, however, may not be universally applicable without further work and refinement. • 3.) Econometrics--How do we measure the cost/benefit or added value of a remote sensing application demonstration project? • Time savings?: How much of the time spent in end-to-end corridor development is spent on environmental assessment as opposed to other tasks? • Benchmarking remote sensing based approach vs. established data or procedures. • Have stakeholder involvement throughout demonstration project.
Environmental Assessment Areas Overall emphasis on streamlining the NEPA process; NEPA requires use of “best available data” A. Wetlands 1. identification/delineation 2. proper functioning condition 3. banking a. identifying potential sites b. monitoring development c. monitoring proper functioning B. Watershed/hydrologic analysis/assessment 1. impervious surface area 2. land cover distribution C. Floodplain Management 1. DEMs with 2 ft. contours D. Stormwater Management/ 1. impervious surface area 2. proper functioning condition 3. need "better" DEMs (2 ft. contours); there are FEMA standards for z value accuracy E. Infrastructure impact 1. stream scour 2. floodplain encroachment F. Water Quality G. Land cover distribution
Environmental Assessment Areas Cont. H. Riparian Data I. Air Quality 1. define ways of reaching or maintaining EPA attainment 2. highway, aviation issues 3. emissions from congestion vs. free-flowing traffic J. Habitat connectivity and maintaining wildlife movement corridors
Assessment Process Issues A. Locating/acquiring data 1. Data directory 2. MPO's need to know what the best data sets are and how/where to get them B. Regulatory authority--who has it? C. Regulatory acceptance--how will remote sensing be embraced in a regulatory setting based on ground-based assessment techniques? D. Accuracy of remote sensing E. Metrics/measurements--do the metrics for existing data transfer to remote sensing data or are different metrics required? F. Cost/Benefit Information G. Education/Outreach--what kind of training programs is needed for new applications?
Criteria for a Successful Remote Sensing Application • Positives, i.e., perceived value, must outweigh negatives • A. Cheaper way to do what needs to be done. For example, characterizing large areas at low resolution with remote sensing may be more cost effective and, therefore, conducive to addressing large area problems. • B. Easier to acquire and/or use • C. Provides "better" information • previously unavailable • available more rapidly • available more frequently • available more readily or on-demand • more detailed/better discriminating power • more complete • more precise • more spatially accurate • from reliable source • integrity/consistency • known/quantifiable errors • more trust/confidence • serves more than one need • associated with documentation/training • heritage of successful application • readily adaptable to existing processing • from reproducible method with less human error/bias