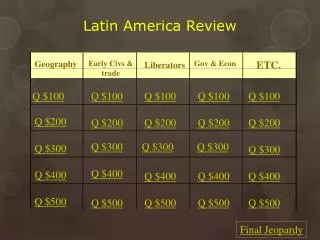
Latin America Review
280 likes | 791 Vues
Latin America Review It can be concluded from the maps that in South America A. there is no relationship between literacy rate and life expectancy B. countries in the southern part of the continent have lower literacy rates than those in the north

Latin America Review
E N D
Presentation Transcript
It can be concluded from the maps that in South America A. there is no relationship between literacy rate and life expectancy B. countries in the southern part of the continent have lower literacy rates than those in the north C. countries in the central part of the continent generally have the highest life expectancy D. literacy rates and life expectancy are generally highest in the same countries
When the ocean and weather patterns in the Pacific water are warmer than normal it is called _________ but when it is cooler than normal it is called _____________. A. El caliente, La Frío B. La Niña, El Niño C. El Niño, La Niña D. La Frío, El caliente
Based on the table, which country has the highest life expectancy? A. Argentina B. Brazil C. Colombia D. Ecuador
Which of the following would be true for Cuba’s economy? A. There is significant surplus with no price controls. B. The government decides what and how to produce. C. The law of supply and demand determines the price of goods. D. Consumer needs change little from one generation to the next.
Which of the following religions is the predominant religion for Latin America? A. Roman Catholic B. Islam C. Protestant D. Indigenous
Based on the literacy rates, which two countries likely have the lowest level of development? A. Nepal and Belize B. Bangladesh and Qatar C. Nepal and Bangladesh D. Bangladesh and Mexico
Which term BEST describes people from other countries who ENTER the United States to start new lives? A. Consumers B. Emigrants C. Immigrants D. Refugees
Which Latin American country has the largest Portuguese speaking population? A. Ecuador B. Suriname C. Columbia D. Brazil
Why does Mexico City struggle with terrible air pollution? A. The city’s physical geography is surrounded by mountains that trap in the pollution. B. Numerous factories and cars create harmful pollutants in the air increasing pollution. C. Mexico’s poor infrastructure makes reducing carbon emissions too expensive. D. All of the above.
Which of the following statements is supported by the table? A. North American countries have the smallest portion of U.S. foreign trade. B. U.S. foreign trade with Canada exceeds U.S. trade with any other country. C. European countries have the largest portion of U.S. foreign trade. D. U.S. foreign trade with China has steadily declined.
Which conclusion can be drawn from the information in the graphs above? A.India is more industrialized than China. B. The United States uses more energy than it produces. C. Brazil is less industrialized than Mexico. D. The United Kingdom produces more energy than any other nation.
What conclusion can you infer about Peru’s population from 2000 to 2025? A. Peru’s mortality rate is increasing. B. Middle aged women live longer than middle aged men C. Peru’s birth rate steadily declined. D. Peru’s life expectancy is decreasing.
Which of these statements is best supported by the information in the chart above? A. Guinea has the lowest GDP and literacy rate in the world. B. Countries with a high literacy rate tend to have a high GDP. C. China has a population larger than the other countries combined. D. Countries with a high literacy rate tend to have low infant mortality rates.
Why has damage from hurricanes in the Caribbean increased with the increase in population? A. Increased paving over soil leaves no where for the water to go. B. Increased clearing of land creates more erosion during heavy rains. C. High-density housing is not as well constructed and cannot withstand storms. D. Hurricanes are stronger today than they were in the past.
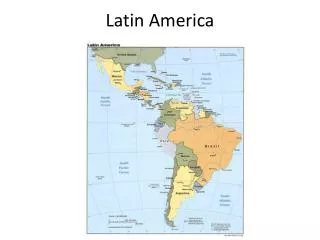
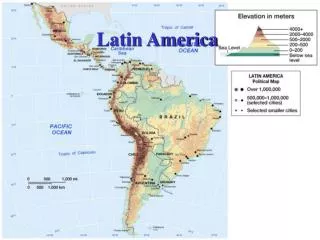
In which region of South America is the Amazon rainforest located? Region A Region B Region C Region D
According to the diagram, the diet of western Europeans changed because of — A. New technologies in food packaging B. The development of new breeds of livestock C. The use of the first food preservatives D. The introduction of new foods from the Americas
Which of the following is a result of the exchange shown in the diagram? A. Native Americans provided livestock to European nations. B. Native Americans employed European farm laborers. C. Native Americans were infected by many European diseases. D. Native Americans began using tobacco grown in Europe.
What is the major cause of poverty in South America? A. Inequality of landownership B. Lack of natural resources C. Ethnic tensions D. Lack of education
What type of landform is Central America? A. An isthmus B. An island C. A continent D. An alluvial fan
The Andes Mountains line the west coast of A. Canada. B. Mexico. C. South America. D.Central America.
Which of these do environmental groups in the Amazon rainforest most want to protect? A. Slash and burn B. Ecotourism C. Deforestation D. Wetlands
What does the acronym NAFTA stand for? A. North American Free Trade Agreement B. North American Food and Transportation Authority C. North American Foreign Travel Association D. North American Federal Transportation Agreement
What was a result of the creation of NAFTA for Mexico? A. Mexico’s GDP decreased B. Markets in the north have opened wider and manufacturing has increased C. Daily life in Mexico has slowed down. D. More Americans have moved south to Mexico.
According to the map, the largest percentage of enslaved Africans were taken to the Caribbean region. What effect did this have on people living in the Caribbean? A Portuguese became the most widely spoken language. B Caribbean societies were more strongly influenced by African culture than were European societies. C Caribbean plantations became highly industrialized as a result of new agricultural techniques brought by Africans. D Native laborers lost their jobs.