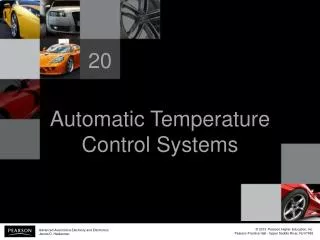
Automatic Temperature Control Systems
20. Automatic Temperature Control Systems. Advanced Automotive Electricity and Electronics James D. Halderman. FIGURE 20.1 The automatic climatic control display is part of the navigation screen on this vehicle.

Automatic Temperature Control Systems
E N D
Presentation Transcript
20 Automatic TemperatureControl Systems Advanced Automotive Electricity and Electronics James D. Halderman
FIGURE 20.1 The automatic climatic control display is part of the navigation screen on this vehicle.
FIGURE 20.2 The outside air temperature sensor is mounted on the radiator core support in front of the A/C condenser on this vehicle.
FIGURE 20.3 The outside air temperature in displayed on the navigation screen on this vehicle and uses the information from the outside air temperature sensor.
FIGURE 20.4 The airflow from the blower causes airflow to flow past the in-vehicle temperature sensor.
FIGURE 20.5 Sun load sensors are usually located at the top of the instrument panel.
FIGURE 20.6 The engine coolant temperature sensor is usually located near the engine thermostat so it can accurately measure the temperature of the coolant.
FIGURE 20.7 Some automatic HVAC system use the information from the factory navigation system to fine tune the interior temperature and airflow needs based on location and the direction of travel.
CHART 20.1 Sample refrigerant system pressures and possible causes as shown from the pressure sensors and displayed on a scan tool. Check service information for the exact procedures to follow if the pressures are not correct.
FIGURE 20.8 The three major portions of the A/C and heat system are air inlet, plenum, and air distribution. The shaded portions show the paths of the four control doors.
FIGURE 20.9 Three electric actuators can be easily seen on this demonstration unit. However, accessing these actuators in a vehicle can be difficult.
FIGURE 20.10 The feedback circuit signals the AC control unit with the blend door position.
FIGURE 20.11 A typical HVAC system showing some of the airflow door locations.
FIGURE 20.12 A dual-climate control system showing the airflow and how it splits.
FIGURE 20.13 A block diagram showing the inputs to the electronic control assembly and the outputs; note that some of the outputs have feedback to the ECM.
FIGURE 20.14 A cabin filter can be accessed either through the glove compartment or under the hood on most vehicles.
CHART 20.2 Sample automatic climatic control diagnostic trouble codes.
FIGURE 20.15 A TECH 2 scan tool is the factory scan tool used on General Motors vehicles.
FIGURE 20.16 An OTC Genisys being used to troubleshoot a vehicle. This scan tool can be used on most makesand models of vehicles and is capable of diagnosing other computer systems in the vehicles such as the automatictemperature control system as well as the antilock braking system (ABS) and airbag systems.
CHART 20.3 Typical sensors and values that may be displayed on a scan tool. Check service information for the exact specifications for the vehicle being serviced.