Download
1 / 71
710 likes | 1.09k Vues
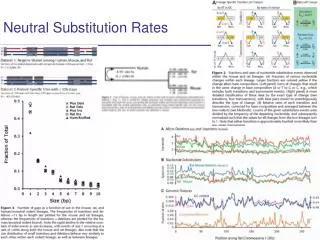
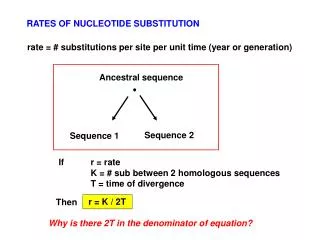
Rates of Nucleotide Substitution. Dan Graur. r = Rate of substitution per site per year K = Number of substitutions per site per year . Mean Rate of Nucleotide Substitution in Mammalian Nuclear Genomes. Less than 10 -9 substitutions/site/year.

E N D
Rates of Nucleotide Substitution Dan Graur
r = Rate of substitution per site per year K = Number of substitutions per site per year
Mean Rate of Nucleotide Substitution in Mammalian Nuclear Genomes Less than 10-9 substitutions/site/year Evolution is a very slow process at the molecular level. Not much happens in evolution. 3
Substitutions Rates in Protein-Coding Regions The rate of synonymous substitution is much larger than the nonsynonymous rate.
A lot A little
Synonymous substitutions are more frequent than nonsynonymous ones.
Mean nonsynonymous rate = 0.75 10–9 substitutions per site per year Mean synonymous rate = 3.65 10–9 substitutions per site per year The synonymous substitution rate is 5 times higher than the nonsynonymous substitution rate Coefficient of variation of nonsynonymous rate = 95% Coefficient of variation of synonymous rate = 31%
The distribution of KA to KS ratios in >13,000 orthologous protein-coding genes from human and chimpanzee
58 nucleotide differences 3 amino acid differences In a comparison of human and yeast ubiquitin genes, the inferred number of synonymous substitutions per synonymous site is ~6 (almost certainly indicative of saturation). The inferred number of nonsynonymous substitutions per nonsynonymous site is 0.03. Thus, synonymous substitutions have accumulated at least 200 times faster than nonsynonymous substitutions.
Ratio 1.5 4.4 1.1
5’ 3’ Divergence between cow and goat b- and g-globin genes and between cow and goat b-globin pseudogenes ______________________________________________ Region K ______________________________________________ 5’ Flanking region 5.3 1.2 5’ Untranslated region 4.0 2.0 4-fold degenerate sites 8.6 2.5 Introns 8.1 0.7 3’ Untranslated region 8.8 2.2 3’ Flanking region 8.0 1.5 Pseudogenes 9.1 0.9 ______________________________________________
Alignment preproinsulin Xenopus MALWMQCLP-LVLVLLFSTPNTEALANQHL Bos MALWTRLRPLLALLALWPPPPARAFVNQHL **** : **.*: *:..* :. *:**** Xenopus CGSHLVEALYLVCGDRGFFYYPKIKRDIEQ Bos CGSHLVEALYLVCGERGFFYTPKARREVEG ***************:******* :*::* Xenopus AQVNGPQDNELDG-MQFQPQEYQKMKRGIV Bos PQVG---ALELAGGPGAGGLEGPPQKRGIV .**. ********* Xenopus EQCCHSTCSLFQLENYCN Bos EQCCASVCSLYQLENYCN *****.***:*******
Fibrinogen to Fibrin • Fibrinogen consists of 6 chains: 2a, 2b, 2g • Fibrinopeptides are very negatively charged • Fibrinopeptides A are cleaved first (to allow polymerization of fibrins) • Fibrinopeptides B are cleaved second (to enhance crosslinking)
Can we explain the different rates of substitution by the selectionist model? • Mutations can be either deleterious or advantageous. • If the fraction of advantageous mutations is large, the rate of evolution will be high. If the fraction of advantageous mutations is small, the rate of evolution will be low. • A mutation occurring at a functional site has a higher probability ofbeing advantageous than a mutation occurring at a nonfunctional site. • Expectation: Important entities should evolve faster than less important ones.
Can we explain the different rates of substitution by the selectionist model? • Mutations can be either deleterious or advantageous. • If the fraction of advantageous mutations is large, the rate of evolution will be high. If the fraction of advantageous mutations is small, the rate of evolution will be low. • A mutation occurring at a functional site has a higher probability ofbeing advantageous than a mutation occurring at a nonfunctional site. • Expectation: Important entities should evolve faster than less important ones.
Can we explain the different rates of substitution by the neutralist model? • Mutations can be either deleterious or neutral. • If the fraction of deleterious mutations is large, the rate of evolution will be low. If the fraction of deleterious mutations is small, the rate of evolution will be high. • A mutation occurring at a functional site has a higher probability ofbeing deleterious than a mutation occurring at a nonfunctional site. • Expectation: Important entities should evolve slower than less important ones.
Can we explain the different rates of substitution by the neutralist model? • Mutations can be either deleterious or neutral. • If the fraction of deleterious mutations is large, the rate of evolution will be low. If the fraction of deleterious mutations is small, the rate of evolution will be high. • A mutation occurring at a functional site has a higher probability ofbeing deleterious than a mutation occurring at a nonfunctional site. • Expectation: Important entities should evolve slower than less important ones.
Functional entities evolve slower than entities devoid of function.
Functional constraint = Degree of intolerance towards mutations at a genomic location. The functional constraint defines the range of alternative residues that are acceptable at a site without affecting negatively the fitness of the organism.
For neutral mutations: K = v Rate of substitution Mutation rate
Kimura’s model of functional constraint Suppose that a fraction, f0, of all mutations are selectively neutral and the rest (1 − f0) are deleterious. Advantageous mutations are assumed to occur only very rarely, such that their relative frequency is effectively zero. If we denote by vT the total mutation rate per unit time, then the rate of neutral mutation, v0, is
According to the neutral theory, the rate of substitution is: Hence, The highest substitution rate is expected in sequences that do not have any function, such that all mutations are neutral
An evolutionary experiment Spalax ehrenberghi
InSpalax,aA-crystallin lost its functional role more than 25 million years ago, when the mole rat became subterranean and presumably lost use of its eyes. The aA-crystallin of Spalax evolves 20 times faster than the aA-crystallins in other rodents, such as rats, mice, hamsters, gerbils and squirrel.
Additional Facts: (1) The aA-crystallin of Spalax possess all the prerequisites for normal function and expression, including the proper signals for alternative splicing. (2) The aA-crystallin of Spalax evolves slowerthan pseudogenes.
Explanation 1: The aA-crystallin gene may not have lost all of its vision-related functions, such as photoperiod perception and adaptation to seasonal changes. Contradicting evidence: The atrophied eye of Spalax does not respond to light.
Explanation 2: The blind mole rat lost its vision more recently than 25 million years ago. The rate of nonsynonymous substitution after nonfunctionalization has been underestimated. Contradicting evidence: The aA-crystallin gene is still an intact gene as far as the essential molecular structures for its expression are concerned.
Explanation 3: • The aA-crystallin-gene product serves another function (unrelated to that of the eye). aA-crystallin is a multifunctional protein • Supporting evidence: • aAcrystallin has been found in other tissues. • aAcrystallin also functions as a chaperonin that binds denaturing proteins and prevents their aggregation. • The regions within aAcrystallin responsible for chaperonin activity are conserved in the mole rat. • The protein has viable secondary and quarternary structures as well as normal thermostability.
Genetic nonfunctionalization or partial nonfunctionalization accelerates evolution. Most evolutionary “action” occurs after death.
The intensity of purifying selection is determined by the degree of intolerance characteristic of a site or a genomic region towards mutations. The functional or selective constraint defines the range of alternative nucleotides that is acceptable at a site without affecting negatively the function or structure of the gene or the gene product. DNA regions, in which a mutation is likely to affect function, have a more stringent functional constraint than regions devoid of function The Concept of Functional Constraint
The stronger the functional constraints on a macromolecule are, the slower its rate of substitution will be.
Functional density (Zuckerkandl 1976) The functional density, F, of a gene is defined as ns/N, where ns is the number of sites committed to specific functions and N is the total number of sites. F, therefore, is the proportion of amino acids that are subject to stringent functional constraints.