Download
1 / 12
120 likes | 279 Vues
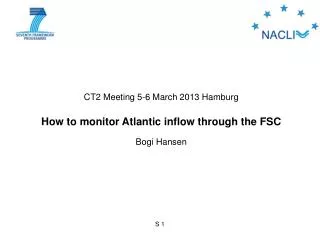
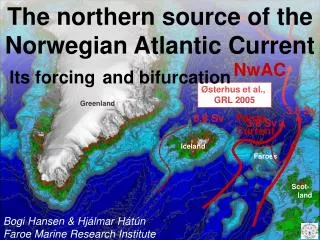
EGU meeting 8 April 2013 Vienna FBC Overflow Bogi Hansen HAV. AGU, 2003. The densest overflow from the Nordic Seas has become warmer and more saline since 1995 Bogi Hansen, Karin M. H. Larsen, Hjálmar Hátún, Regin Kristiansen, Ebba Mortensen, Svein Østerhus, Detlef Quadfasel.

E N D
AGU, 2003 The densest overflow from the Nordic Seas has become warmer and more saline since 1995Bogi Hansen, Karin M. H. Larsen, Hjálmar Hátún, Regin Kristiansen, Ebba Mortensen,Svein Østerhus, Detlef Quadfasel With entrainment, the FBC-overflow feeds ~ 25% of NADW Greenland Faroe Bank Channel Sill depth: 840 m Iceland Faroes Shet- land FBC-overflow: 2 Sv + entrained water: 2 Sv image:AGU 2003
FBC - overflow Monitored since November 1995 ADCP in flotation Dinner
Volume transport(monthly averaged “kinematic” overflow) Average: 2.15 Sv Change: 0.18 ± 0.15 Sv = 8% ± 7%
OWSM Potential temperature at OWSM FBC sill: 840 m Warming Warming
Bottom temperature at sill 2 .5 - 0 . 3 Volume transport 2.0 - 0 . 4 1 .5 Bottom temperature (°C) 1.0 - 0 . 5 Volume transport (Sv) Bottom temperature 0 .5 0 - 0 . 6 1 9 9 6 1 9 9 8 2 0 0 0 2 0 0 2 2 0 0 4 2 0 0 6 2 0 0 8 2 0 1 0 2 0 1 2
Bottom temperature decreases with increasing volume transport Bernoulli aspiration Weak flow Strong flow Correlation coefficient: -0.49
OWSM Bottom temperature Section N 800 m - 0 . 3 FBC sill 840 m OWSM 800 m - 0 . 4 Section N 900 m 1000 m - 0 . 5 FBC bottom temperature adjusted for transport variations - 0 . 6 1 9 9 6 1 9 9 8 2 0 0 0 2 0 0 2 2 0 0 4 2 0 0 6 2 0 0 8 2 0 1 0 2 0 1 2
FBC bottom temperature has increased since ~ 2000 2 .5 - 0 . 3 Uncertainty 2.0 - 0 . 4 ~ 0.1ºC 1 .5 Bottom temperature (°C) Δσθ≈ -0.004 kg/m3 1.0 - 0 . 5 Volume transport (Sv) 0 .5 0 - 0 . 6 1 9 9 6 1 9 9 8 2 0 0 0 2 0 0 2 2 0 0 4 2 0 0 6 2 0 0 8 2 0 1 0 2 0 1 2
Salinity at fixed temperatureat section S Section S Δσθ≈ +0.025 kg/m3 Salinity at 1ºC ΔS ≈ 0.005 Salinity at -0.45ºC Δσθ≈ +0.004 kg/m3
Faroe Bank Channel overflow • Volume transport has not decreased • probably, it has increased • The overflow has become warmer, but also more saline • The density has not decreased • probably, it has increased
The research leading to these results has received funding from the European Union 7th Framework Programme (FP7 2007-2013), under grant agreements n.308299 NACLIM www.naclim.eu and n.212643 THOR www.eu-thor.eu