Understanding Discrete Probability Distributions in Biostatistics
This lecture by Dr. Petr Nazarov provides a comprehensive overview of discrete probability distributions and their significance in biostatistics. Topics covered include random variables, probability distribution functions, expected values, variances, the discrete uniform distribution, binomial distribution, hypergeometric distribution, and Poisson distribution. Practical examples using real-life scenarios, such as experiments with mice and medical treatments, illustrate these concepts, enabling students to grasp the application of statistical principles in biological research.

Understanding Discrete Probability Distributions in Biostatistics
E N D
Presentation Transcript
Microarray Center BIOSTATISTICS Lecture 2 Discrete Probability Distributions dr. Petr Nazarovpetr.nazarov@crp-sante.lu 1-03-2012
OUTLINE Lecture 2 • Random variables • Discrete probability distributions • discrete probability distribution • expected value and variance • discrete uniform probability distribution • binomial probability distribution • hypergeometric probability distribution • Poisson probability distribution
Discrete random variable A random variable that may assume either a finite number of values or an infinite sequence of values. Continuous random variable A random variable that may assume any numerical value in an interval or collection of intervals. Roll a die Weight, height, blood pressure, etc Volume of a sample in a tube Number of calls to a reception per hour Time between calls to a reception RANDOM VARIABLES Random Variables Random variable A numerical description of the outcome of an experiment. A random variable is always a numerical measure.
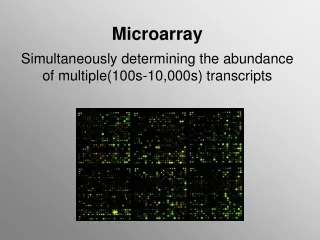
DISCRETE PROBABILITY DISTRIBUTIONS Probability Distribution and Probability Function Probability distribution A description of how the probabilities are distributed over the values of the random variable. Number of cells under microscope Random variable X: x = 0 x = 1 x = 2 x = 3 … Probability function A function, denoted by f(x), that provides the probability that x assumes a particular value for a discrete random variable. Roll a die Random variable X: x = 1 x = 2 x = 3 x = 4 x = 5 x = 6 P.D. for number of cells
DISCRETE PROBABILITY DISTRIBUTIONS Expected Value and Variance Expected value A measure of the central location of a random variable, mean. Variance A measure of the variability, or dispersion, of a random variable. Roll a die Random variable X: x = 1 x = 2 x = 3 x = 4 x = 5 x = 6
DISCRETE UNIFORM DISTRIBUTION Discrete Uniform Probability Function Discrete uniform probability distribution A probability distribution for which each possible value of the random variable has the same probability. n – number of values of x = (xi / n) = (xi) / n = 3.5 2 = 2.92 = 1.71
BINOMIAL DISTRIBUTION Binomial Experiment Example Assuming that the probability of a side effect for a patient is 0.1. What is the probability that in a group of 3 patients none, 1, 2, or all 3 will get side effects after treatment? Binomial experiment An experiment having the four properties: 1. The experiment consists of a sequence of nidentical trials. 2.Two outcomes are possible on each trial, one called success and the other failure. 3. The probability of a success p does not change from trial to trial. Consequently, the probability of failure, 1–p, does not change from trial to trial. 4. The trials are independent. n trials
BINOMIAL DISTRIBUTION Binomial Probability Function Binomial probability distribution A probability distribution showing the probability of x successes in n trials of a binomial experiment, when the probability of success p does not change in trials. Probability distribution for a binomial experiment Probability of red p(red)=1/3, 3 trials are given. Random variable = number of “red” cases f(0) = 8/27 = 0.296 f(1) = 4/9 = 0.444 f(2) = 2/9 = 0.222 f(3) = 1/27 = 0.037 Test: f(x) = 1
BINOMIAL DISTRIBUTION Example: Binomial Experiment • Example • Assuming that the probability of a side effect for a patient is 0.1. • What is the probability to get none, 1, 2, etc. side effects in a group of 5 patients? • What is the probability that not more then 1 get a side effect • What is the expected number of side effects in the group? p = 0.1 n = 5 • In Excel 2003: • = BINOMDIST(x,n,p,false) • In Excel 2010: • = BINOM.DIST(x,n,p,false) 3. 0.5 1. 2.
Q3. P(0 or 5) = P(0) + P(5) = 0.03 + 0.03 = 0.06 • Assume that a family has 4 girls already. What is the probability that the 5th will be a girl? ? BINOMIAL DISTRIBUTION Practical : Binomial Experiment • Assume the probability of getting a boy or a girl are equal. • Calculate the distribution of boys/girl in a family with 5 children. • Plot the probability distribution • Calculate the probability of having all 5 children of only one sex
n trials HYPERGEOMETRIC DISTRIBUTION HypergeometricExperiment Example There are 12 mice, of which 5 have an early brain tumor. A researcher randomly selects 3 of 12. What is the probability that none of these 3 has a tumor? What is the probability that more then 1 have a tumor? Hypergeometric experiment A probability distribution showing the probability of x successes in n trials from a population Nwith r successes and N-r failures. Assign x, n, r, N Calculate p(x) using Excel • In Excel 2010 use the function: • = HYPGEOM.DIST (x,n,r,N) In Excel 2003 use HYPGEOMDIST (x,n,r,N)
HYPERGEOMETRIC DISTRIBUTION Example: Hypergeometric Distribution for Mice • Example • There are 12 mice, of which 5 have an early brain tumor. A researcher randomly selects 3 of 12. • What is the probability that none of these 3 has a tumor? • What is the probability that more then 1 have a tumor? Q1. P(0) =0.159 Q2. P(>1) =P(2)+P(3)=0.364 • In Excel use the function: • = HYPGEOM.DIST (x,n,r,N)
POISSON DISTRIBUTION Poisson Probability Function Example Number of calls to an Emergency Service is on average 3 per hour b/w 2 a.m. and 6 a.m. of working days. What are the probabilities to have 0, 5, 10 calls in the next hour? Poisson probability distribution A probability distribution showing the probability of x occurrences of an event over a specified interval of time or space. Poisson probability function The function used to compute Poisson probabilities. where – expected value (mean) • In Excel 2010 use the function: • = POISSON.DIST(x,mu,false) In Excel 2003 use the function: = POISSON(x,mu,false)
Q3. P(<4) = P(0)+P(1)+P(2)+P(3)=0.857 Q2. P(0) = 0.135 Q4. P(>1) =1-P(0)-P(1)=0.594 POISSON DISTRIBUTION Example: Poisson Distribution for Fish Counting Example An ichthyologist studying the spoonheadsculpin catches specimens in a large bag seine that she trolls through the lake. She knows from many years experience that on averages she will catch 2 fish per trolling. 1. Draw distribution Find the probabilities of catching: 2. No fish; 3. Less than 4 fishes; 4. More then 1 fish. • In Excel use the function: • =POISSON.DIST(x,mu,false) Glover , Mitchell, An Introduction to Biostatistics
QUESTIONS ? Thank you for your attention to be continued…