Location Clustering
210 likes | 320 Vues
Location Clustering. Peter Kamm Marcel Flores. The Data Set. Sessions Contains a collection of connections over the course of a week User ID, Start time, stop time, Tower ID 25 million lines!. ...a little more. A tower location mapping Tower ID, Longitude, Latitude, Zip Code

Location Clustering
E N D
Presentation Transcript
Location Clustering Peter Kamm Marcel Flores
The Data Set • Sessions • Contains a collection of connections over the course of a week • User ID, Start time, stop time, Tower ID • 25 million lines!
...a little more • A tower location mapping • Tower ID, Longitude, Latitude, Zip Code • Allows us to map to a real world location • Data set is not complete • There are many towers we do not have a location for
Applications • Load balancing on the cell-phone networks themselves • Social Networking • Integrate online social networks with the real world • Accounts for mobility and usage patterns
Analysis • See which locations are active at what times • Where do people congregate? • How strongly do they congregate? • Does the locations affect their usage • Connection Duration • How does this map out into the physical world?
Day and Night Hotspots • Now uses a proper qualitative metric • Looks at all ratio of day to night (or night to day, depending on which is larger) • Rejected locations with <100 day or night sessions • Gives us a number >1 to rank strength of location • Daytime is defined as 4am to 4pm • Day has more “very strong” hotspots
Day - 4,479 total Strength Distribution Night - 10,812 total
Durations • Day/night hotspots tend to exhibit similar patterns of usage • Longest connections during morning/evening commute • Urban towers get longer connections in mornings, residential neighborhoods get longer connections in evenings
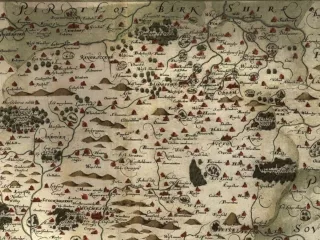
Physical Locations • Have to be done by hand, smaller sample • Incomplete, do not have locations for all towers • For the highest ranked locations • Sadly the top 4 shown previously not in location data set! • In fact, none of the high-ratio day or night spots appear (until down to a ratio of <2)!
Some Locations… • Tower 79 - Night Tower, 1.255 ratio • Located in Englewood • Residential • South Chicago • Not very strong ratio
Tracing a User • Turns out, the data set was (maybe) rich enough to provide information on a per user level! • Followed the first 5000 users in the data set, ranked them based on activity • Considered the busiest (by hand) • Compared to day/night ratio of each location
Tracing a User: Results • User 1: • Busiest at tower 24 (20,729) • Night tower with a 2.339 ratioBut the user accounts for over 99% of the tower traffic! • 2nd Busiest at tower 1197 (3,660) • Night tower with a 1.528 ratio • Again accounts for 99% of traffic!
Tracing a User: Results • User 5: • Busiest at tower 258 (7,449) • Night tower with a 1.711 ratio (75% of traffic!) • No location data • 2nd Busiest at tower 309 (5,773) • Night tower with a 1.765 ratio (only 60%…) • Residential, Longview, Washington
Tracing a User: Results • Had to go to user 113 to get a more reasonable user • Busiest at tower 100 (1,602) • Night tower at 1.207 ratio • Not an unreasonable amount of traffic • Solon, Iowa • Second busiest at 5045 (602) • Night tower at 2.004
Hotspots • Looking at certain user traces, seemed that certain users seemed to use the busiest towers the most • So are the busiest towers really seeing a lot of users, or a few very busy users? • Analyzed the numbers of unique users that a tower sees in a day
Unique User Data • Count how many users a specific tower sees over the duration • Allows us to give an alternate ranking of the tower traffic • Easily ignore points where a single user accounts for the majority of a towers traffic • Actual data is forthcoming…