Download
1 / 57
570 likes | 603 Vues
Discover the practical use of the glycemic index and glycemic load for health benefits. Learn what to eat, analyze case studies, and engage in hands-on activities. Explore factors influencing GI ranking and how different foods affect glycemic levels.

E N D
Gushers and Tricklers: Practical Use of the Glycemic Index Johanna Burani, MS, RD, CDE American Diabetes Association Southern Regional Conference Marco Island, Florida May 26, 2006
Introduction • Let’s discuss: • Glycemic Index • Glycemic Load • Health Benefits • What to Eat • Case Study • Hands-on Activities
Glycemic Index (GI) What is the glycemic index? A scale that ranks carbohydrates by how much they raise blood glucose levels compared to a reference food.
Glycemic Index (GI): Ranking Low 0 – 55 Moderate 56 – 69 High 70 or more
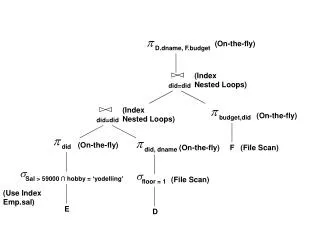
Glycemic Index (GI): Protocol • 25 or 50 grams carbohydrate of test food. • Blood samples taken: • 1st hour: every 15 minutes • 2nd hour: every 30 minutes • 3rd hour: every 30 minutes* • 3. Values plotted; AUC calculated. • 4. Test food response compared to reference food response. • 5. Average GI of 8-10 volunteers = GI of test food. * DM volunteers only.
Glycemic Index (GI): Sample Graphs Adapted from Good Carbs Bad Carbs Reprinted courtesy of Marlowe & Company.
Factors Influencing GI Ranking • Type of starch
Factors Influencing GI Ranking Type of Starch Amylose Amylopectin • Absorbs less water • Molecules form tight clumps • Slower rate of digestion • Absorbs more water • Molecules are more open • Faster rate of digestion Lower GI Kidney beans (28) Uncle Ben’s converted LG rice (50) Higher GI Russet potato (85) Glutinous rice (98)
Factors Influencing GI Ranking • Type of starch • Physical entrapment
Factors Influencing GI Ranking Physical Entrapment Bran acts as a physical barrier that slows down enzymatic activity on the internal starch layer. Lower GI All Bran (38) Pumpernickel bread (50) Higher GI Bagel (72) Corn Flakes (92) Bran Endosperm Germ
Factors Influencing GI Ranking • Type of starch • Physical entrapment • Viscosity of fiber
Factors Influencing GI Ranking Viscosity of Fiber Viscous, soluble fibers transform intestinal contents into gel-like matter that slows down enzymatic activity on starch. Lower GI Apple (40) Rolled oats (51) Higher GI Whole wheat bread (73) Cheerios (74)
Factors Influencing GI Ranking • Type of starch • Physical entrapment • Viscosity of fiber • Sugar content
Factors Influencing GI Ranking Sugar Content sugar sucrose glucose + fructose (GI 60) (GI 100) (GI 19) starch maltose glucose + glucose (GI 105) (GI 100) (GI 100) Lower GI Frosted Flakes (55) Raisin Bran (61) Higher GI Golden Grahams (71) Rice Krispies (82)
Factors Influencing GI Ranking • Type of starch • Physical entrapment • Viscosity of fiber • Sugar content • Fat and protein content
Factors Influencing GI Ranking Fat & Protein Content Fat and protein slow down gastric emptying, and thus, slows down digestion of starch. Lower GI Peanut M&M’s (33) Potato chips (54) Special K (69) Higher GI Jelly beans (78) Baked potato (85) Corn Flakes (92)
Factors Influencing GI Ranking • Type of starch • Physical entrapment • Viscosity of fiber • Sugar content • Fat and protein content • Acid content
Factors Influencing GI Ranking Acid Content Acid slows down gastric emptying, and thus, slows down the digestion of starch. Lower GI Sourdough wheat bread (54) Higher GI Wonder white bread (73)
Factors Influencing GI Ranking • Type of starch • Physical entrapment • Viscosity of fiber • Sugar content • Fat and protein content • Acid content • Food processing
Factors Influencing GI Ranking Food Processing Highly processed foods require less digestive processing. Lower GI Old fashioned, rolled oats (51) Higher GI Quick, 1-minute oats (66)
Factors Influencing GI Ranking • Type of starch • Physical entrapment • Viscosity of fiber • Sugar content • Fat and protein content • Acid content • Food processing • Cooking
Factors Influencing GI Ranking Cooking Cooking swells starch molecules and softens foods, which speeds up the rate of digestion. Lower GI Al dentespaghetti – boiled 10 to 15 minutes (44) Higher GI Over-cooked spaghetti – boiled 20 minutes (64)
Factors Influencing GI Ranking Type of starch Cooking Food processing Physical entrapment Viscosity of fiber Acid content Sugar content Protein content Fat content How does all this affect our glycemic levels? How does all this make us feel after eating carbohydrate-containing foods?
Glycemic Load (GL): What does it mean? Glycemic load measures the degree of glycemic response and insulin demand produced by a specific amount of a specific food. Glycemic load reflects both the quality and the quantity of dietary carbohydrates. GL = GI/100 x CHO (grams) per serving Example: GL of an apple = 40/100 x 15g = 6g
Glycemic Load (GL): Ranking Individual food portion: Low 0-10 Moderate 11-19 High 20+ Whole day: Low < 80 Moderate 100 High > 120
Glycemic Load: helps predict blood glucose response to specific amount of specific carbohydrate food. GL = glycemic quality quantity GI vs. GL Glycemic Index: ranks carbohydrates based on their immediate blood glucose response. GI = glycemic quality
YES! type 2 DM risk BG levels cholesterol levels heart disease risk weight Benefits of Low GI Diet Are there any documented benefits to lowering the GI of one’s diet?
Benefits of Low GI Diet Low GI diet helps lower blood glucose levels. Meta-analysis of 14 studies, 356 subjects (types 1 & 2 DM), 2-52 weeks duration Mean difference - 7.4% in glycated proteins over & above reduction from high GI diet. - 0.43% points in HbA1c over & abovereduction from high GI diet Brand-Miller et al. Diabetes Care. 2003; 26; 2263.
Benefits of Low GI Diet Low GI diet helps lower blood glucose levels. EURODIAB IDDM Complications Study, 1996 2,054 people, 15-60 y, with type 1 DM Buyken et al. Am J Clin Nutr. 2001; 73; 578.
Benefits of Low GI Diet Low GI diet aids in weight control. Nurses’ Health Study, 1984-1996 74,091 women, 38-63 y Calculated odds ratios (lowest > highest quintiles) Lin et al. Am J Clin Nutr. 2003; 78; 923.
pre LGI-MNT post LGI-MNT Benefits of Low GI Diet Low GI diet aids in weight control. Post low GI MNT counseling, 21 subjects, 21-89 y, 3-36 mos. Burani & Longo. Diabetes Educ. 2006; 32; 83.
Benefits of Low GI Diet Low GI diet decreases risk of diabetes. Nurses’ Health Study, 1986-1992 65,173 US women 40-65 y, free of DM 6 year follow-up: 915 cases of type 2 DM Salmeron et al. JAMA. 1997; 277; 472.
Benefits of Low GI Diet Low GI diet decreases risk of diabetes. Health Professionals’ Follow-up Study, 1986-1992 42,759 US men 40-75 y, free of DM 6 year follow-up: 523 cases of type 2 DM Salmeron et al. Diabetes Care. 1997; 20; 245.
What Should I Eat? http://www.mypyramid.gov
Balance calories in with calories out. Eat balanced diet with variety of nutrient-dense foods and beverages. Consume 2 cups fruit, 2½ cups vegetables per day. (2,000 calories intake) Choose whole grains for at least half of daily grain consumption. Consume 3 cups FF/LF milk or equivalent. Keep fat consumption 20-35% of daily calories. (mono & polyunsaturated) Consume less than 2300 mg sodium/day. Choose foods with little added sugar or caloric sweeteners. Drink alcohol in moderation. Practice food safety handling and preparing rules. What Should I Eat? 2005 Dietary Guidelines
Caution! Do not focus exclusively on achieving a low glycemic load diet with all low glycemic index food choices. Result could be: high fat low carbohydrate low fiber calorically dense Instead…
A Better Idea Aim for a well-balanced diet that includes low glycemic index carbohydrates. Use glycemic load as a guide for controlling portions. Hint: Low GI CHOs allow for larger portions, while regulating the GL. High GI CHOs require smaller portions to regulate the GL.
Pictures of Low/High GI Meals & Snacks GI = 60 GL = 48 GI = 42 GL = 31
Pictures of Low/High GI Meals & Snacks GI = 85 GL = 48 GI = 39 GL = 22
Pictures of Low/High GI Meals & Snacks GI = 83 GL = 19 GI = 14 GL = 1
Pictures of Low/High GI Meals & Snacks GI = 80 GL = 32 GI = 61 GL = 12
Pictures of Low/High GI Meals & Snacks GI = 57 GL = 31 GI = 32 GL = 16
What Should I Eat? How to increase consumption of low GI foods Eat high-fiber breakfast cereals (oats, bran, barley) OR Add berries, nuts, flaxseed and cinnamon to high GI cereals.
What Should I Eat? How to increase consumption of low GI foods Choose dense, whole grain and sourdough breads and crackers. OR Add a heart-healthy protein and/or condiment to high GI breads and crackers.
What Should I Eat? How to increase consumption of low GI foods Include 5-9 servings of fruits and vegetables every day. OR No ifs, ands or buts – just do it! (Mom was right.)
What Should I Eat? How to increase consumption of low GI foods Replace white potatoes with yams or sweet potatoes. OR Try canned new potatoes, or just eat smaller portion of high GI potatoes.
What Should I Eat? How to increase consumption of low GI foods Eat less refined sugars and convenience foods (soda, sweets, desserts, etc.) OR Combine nuts, fruit, yogurt, ice cream with commercial sweets – just watch portion sizes.
Case Study – “Amy” 38 YO administrative assistant Married, no children Height: 5’7” Weight: 320 lbs. BMI: 50 (severe obesity) Type 2 DM since age 35 A1c: 6.3 (Glucophage 500 mg) BP: 148/90 (Altace 10 mg) Before
Case Study – Amy’s Before Diet Breakfast: toasted bagel with cream cheese, 16 oz. orange juice, large coffee with whole milk Lunch: 6” roast beef & cheese sub sandwich w/ mayo, 20 oz. diet Pepsi Snack: (“all afternoon long”) 13 oz. bag Hershey miniature chocolate bars Dinner: ½ box macaroni & cheese (made w/ 2% milk), 3 beef hot dogs on buns, water Snack: 1 ½ cups ice cream 6250 Kcal: 43% CHO (666g), 11% PRO (173g), 46% fat (321g) GI = 57 (moderate) GL = 352 (very high)


![[PDF] DOWNLOAD Glycemic Index Diet For Dummies](https://cdn7.slideserve.com/12557470/slide1-dt.jpg)