Download
1 / 25
250 likes | 365 Vues
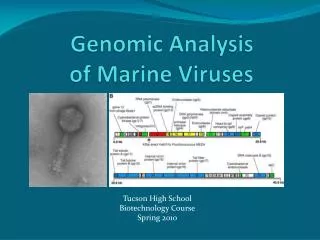
Boyce Thompson Institute for Plant Science. Cornell University. Oklahoma State University. University of North Carolina at Chapel Hill. Genomic analysis of water use efficiency. http://isotope.bti.cornell.edu/. Cornell/Boyce Thompson: Jonathan Comstock, Susan McCouch Christine Fleet

E N D
Boyce Thompson Institute for Plant Science Cornell University Oklahoma State University University of North Carolina at Chapel Hill Genomic analysis of water use efficiency http://isotope.bti.cornell.edu/
Cornell/Boyce Thompson: Jonathan Comstock, Susan McCouch Christine Fleet Roman Pausch Wendy Vonhof Shiqin Xu Yunbi Xu Oklahoma State: Bjorn Martin, Chuck Tauer Shakuntala Fathepure Baige Zhao UNC Chapel Hill: Todd Vision Maria Tsompana Lindsey Swanson Collaborators
Water use efficiency • A fundamental trade-off for plants • Open stomates allow photosynthesis • But also result in water loss • WUE is the ratio of carbon fixed to water lost • Somewhat related to drought tolerance • More closely to yield potential under irrigation • Water is the most limiting resource to global agricultural production • In some crops, and under some conditions, greater WUE would be desirable and in others less
Three levels of WUE • Whole-field (under agronomic control) • Whole-plant (driven by respiration) • Single-leaf (focus here)
Leaf-level WUE sun wind ci wi H2O CO2 ca wa
The challenges of working with WUE • WUE is a complex trait • Rarely if ever controlled by a single gene • Very sensitive to environment • Breeding for WUE has not worked • Too many deleterious side-effects • We know almost nothing about the molecular biology of how plants adjust their WUE • Could we engineer WUE if we knew more? • QTL mapping as a “foot in the door” to discover the pathways involved in WUE
P1 (+) P2 (-) F1 (0) LOD Quantitative trait loci (QTL) + + F2 0 -
Stable carbon isotopes • Direct physiological measurement of WUE is not quick and cheap enough for QTL studies - a proxy is needed • Stable isotopes are naturally occuring • Atmospheric CO2 is 99 12C : 1 13C • Rubisco, the key enzyme in carbon fixation, discriminates against 13C • Easily measured by mass spectrometry
Isotope measurements • Isotopic ratio R = 13C/12C • Discrimination index D = (Rair/Rplant) – 1
D and WUE • Both ∆ & WUE depend on the CO2 diffusion gradient • In C3 plants, variation in this gradient is the primary determinant of D and leaf-level WUE. • D provides a high-throughput proxy for ci • Values of D are typically negative • Values closer to zero represent greater WUE (more carbon fixed per unit of water)
Goals • To dissect natural variation in WUE • Discovery and characterization of WUE quantitative trait loci (QTL) • Rice (upland vs rice paddy cultivation) • Tomato (desert versus cultivated species) • Lay ground-work for positional cloning • Fine mapping • Introgression lines
Survey of variability in rice • Assayed variation in D among • Landraces and elite cultivars • Related wild species • The offspring of four wide crosses • Lamont x Teqing • Kasalath x Nipponbare • IR64 x Nipponbare • O. rufipogon x Jefferson • Variation in the offspring of a single cross can be as wide as the variation among all cultivated/wild accessions! • Upland/lowland distinction not that helpful…
LOD=8.60 WUE QTL On Chromosome 1 Genetic Map Genomic sequence www.gramene.org
Mapping WUE QTL in tomato • Wild desert species of tomato (e.g. Solanum pennellii) have high WUE relative to cultivated species (S. lycopersicon) • On the minus side • The genome sequence is not available yet • On the plus side • Zamir introgression lines for S. lycopersicon x S. pennellii greatly facilitate mapping
Possible physiological basis for WUE • Several of the candidate QTL lines have • High nitrogen content = abundant protein • Low specific leaf area (m2/g) • These correlates suggest that increased carboxylation capacity may be responsible for greater WUE in these QTL
Finding crossovers within IL5-4 • QTL can be located more precisely if IL5-4 introgression can be broken up • Backcrossed IL5-4 to cultivated parent • Genotyped F2 progeny for flanking markers
mm mm mm mm mm mm mm mm mm Principle of fine-mapping(Mendelization) qq qq qq internal marker 1 flanking marker 2 flanking marker 1 QTL
Fine-mapping IL5-4 QTL • 16 crossovers obtained from ~2000 backcross F2 plants • These were selfed to produce backcross F3s • D values obtained for F3 plants • Scoring internal STS markers • These allow us to align to the tomato physical map • One internal STS marker done • Several more in development • AFLP markers are currently being mapped • Not physically mapped, but abundant and easy to score
IL5-3 73.9 TG351 72.7 TG351 TG60 104 76.2 TG60, CT80 75 TG60,CT80 78.4 CP58B, CHS3 77.2 CP58B,CHS3 QTL 105 T1777 IL5-4 106 SSR590, T1541 108 T1584 86.1 CD78 84.9 CD78 111 88.7 TG69 87.5 TG69 TG69 F2 2000 IL Population F2 1992 IL5-5 PCR length polymorphism already scored SSR marker available dCAPS marker available Screening for polymorphisms (1 or more introns predicted) Screening for polymorphisms (no intron predicted) Primers under development
Now what? • Adding additional STS to IL5-4 (UNC) • Goal is <1cM (=1 Mb) resolution • Identifying BAC contigs containing markers in QTL candidate region (UNC) • BAC skimming to obtain high density markers • Comparative mapping in Arabidopsis for candidate gene analysis • Generating overlapping congenic lines in IL5-4 by marker assisted selection (OSU)