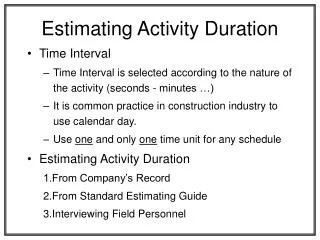
Estimating Activity Duration
Estimating Activity Duration. Time Interval Time Interval is selected according to the nature of the activity (seconds - minutes …) It is common practice in construction industry to use calendar day. Use one and only one time unit for any schedule Estimating Activity Duration

Estimating Activity Duration
E N D
Presentation Transcript
Estimating Activity Duration • Time Interval • Time Interval is selected according to the nature of the activity (seconds - minutes …) • It is common practice in construction industry to use calendar day. • Use one and only one time unit for any schedule • Estimating Activity Duration 1.From Company’s Record 2.From Standard Estimating Guide 3.Interviewing Field Personnel
Weather and Contingency Allowance • Two approaches for assignment of weather allowance: 1.Add the Weather Allowance at the end of the project as a separate activity 2.Add Weather Allowance to those affected by the weather. • Can add weather allowance at the end of each construction segment (site preparation, foundation …etc. • Other contingency items • Procurement Allowance • Strikes • Time Zone • The close of the work period immediately preceding the start of the project.
Precedence Diagram • Advantages of Using Precedence Diagram 1.No dummy activity are required. 2.A single number can be assigned to identify each activity. 3.Analytical solution is simpler. • Numbering System Same concepts used in Arrow diagram • Even or odd or in fives or tens • Smaller numbers to the left • Each Activity has its unique number.
Redundant Linkages 20 A 30 B 40 C (a) Incorrect Representation 20 A 30 B 40 C (b) Correct Representation
Closing the network to givesingle beginning and ending nodes A E B C F (a) Incorrect Representation A E Start Dummy Finish Dummy B C F (b) Correct Representation
Retaining Wall Precedence Diagram Wall 2 20 Footing 2 Wall 1 10 Footing 1 40 Wall 2 Footing 2 Footing 1 30 Wall 1
Precedence Diagram -Sequence Stepped and Numbered 10 A 25 E 5 Start 35 Finish 15 B 20 C 30 F 1 2 3 4
Advantage of Using Precedence Diagram 1.No dummy activities are required. 2.A single number can be assigned for identify each activity. 3.Analytical solution is simpler.
Constructing the Diagram 1.Constructing the Diagram • Activities with no dependencies arranged at the left • Create a dummy start called “Contract Award” • Ball-of-string provides a mean to determine sequence steps for each activity. 2.Arrange Activities in a Sequential Order • Start by activity “Contract Award” • Possible sequence step are these activities located at the arrow head.
Create Activity List • List all the possible activities beginning with an active verb. (strip, repair...) • Consider all procurement activities • Obtain vinyl floor covering • Obtain cabinet • Painter availability. “Labor Procurement” • Consider the relationship among the activities • What does each activity depend upon? • The planner must ask the field personnel how they plan for the job, and why things should be done the way proposed.
Constructing the Precedence Diagram 1.Create Activity list and eliminate redundancies. 2.Construct Rough Diagram “Ball of string” • Activities with no dependency arranged at the left • Create dummy start if you have more than one start “Contract Award” • Ball-of-string provides a mean to determine sequence steps for each activity. 3.Arrange Activities in a sequential order • Start by first activity “Contract Award” • Possible sequence steps are those activities located at the arrowhead
Additional Rules/Practices 1.Event numbering is usually entered after completing the diagram. 2.Common practice to assign i, j in such a way that the number at the tail is small than that at the head. 3.Choose some numbering pattern such as • Even number • Odd number • Numbers in fives or tens
Tabular Format (Precedence Diagram) • Can be carried out on the tabular form without preference to the diagram. • Advantage: The time required to construct the diagram is eliminated. • Determination of early start and finish date • Start by time zero and add duration to get EF for A, B, C, D • For E choose the maximum EFD of 8 or C
Determining Lag LAG5-10 = ESD10 - EFD5 = 4 - 4 = 0 LAG15-25 = ESD25 - EFD15 = 12 - 7 = 5 LAG20-25 = ESD25 - EFD20 = 12 - 6 = 6
Determining The Free-Float • Free Float is the minimum of the lag of the link that follow an activity. • Look at the “Pre. Column” to find the same number value of EF for terminal activity “not following act.” FF35 = LFD35 - EFD35 = 20 - 20 = 0
Determining the Total Float “Backward” • Take TF of the terminal activity = 0 or FF35 = LFD35 - EFD35 = 20 - 20 = 0 TFI = Min (LAGIJ + TFJ) TF30 = Min (LAG30-35 + TF35) = Min (7 + 0) = 7 No other link TF20 = Min LAG20-25 + TF25 = Min 6 + 0 = 6 LAG20-30 + TF30 1 + 7 { } { }
INDF • If the free float is zero - no INDF INDFJ = FFJ - MaxI (TFI - LAGIJ) INDF20 = FF20 - Max(TF5 - LAG5-20) = 1 - (0 - 0) = 1 INDF30 = FF30 - Max TF15 - LAG15-30 TF20 - LAG20-30 =7 - 5 - 0 = 2 6 - 1 { } { }