Download
1 / 50
500 likes | 757 Vues
GIS (Geographic Information Systems) Applications in marketing Austin College April 2014. Dr. Ronald Briggs Professor Emeritus The University of Texas at Dallas Program in Geospatial Information Sciences briggs@utdallas.edu. Overview. Geographic Information technologies GIS data concepts

E N D
GIS(Geographic Information Systems)Applications in marketingAustin CollegeApril 2014 Dr. Ronald Briggs Professor Emeritus The University of Texas at Dallas Program in Geospatial Information Sciences briggs@utdallas.edu
Overview • Geographic Information technologies • GIS data concepts • Applications • In marketing • In environmental studies (at noon)
Geographic Information Technologies GIS: one of three technologies which have revolutionized the handling of spatial or locational data, which is critical for marketing • Global Positioning Systems (GPS) • Remote Sensing (RS) • Geographic Information Systems (GIS) Made it easy to do things which in the past had been time consuming, expensive, or even impossible .
Geographic Information Technologies • 1. Global Positioning Systems (GPS) • a system of earth-orbiting satellites which provide precise location on the earth’s surface • GPS gave us exact locations inexpensively • didn’t need an expensive surveyor
Geographic Information Technologies • 2. Remote Sensing (RS) • collecting data without direct contact with the object being measured • use of satellites or aircraft to capture information about the earth’s surface • Expensive field surveys far less necessary • Especially important for environmental applications
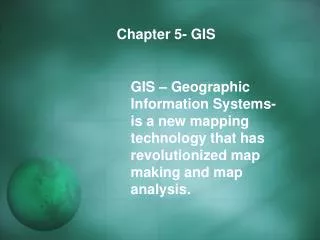
Geographic Information Technologies • 3. Geographic Information Systems (GIS) • Software systems for input, storage, retrieval, analysis and display of geographic (spatial) information • gave us inexpensive map production/display and easier analysis • don’t need a professional cartographer • But still need analysts! Analysis Input Display
The Synergism of Three Technologies • GPS and Remote Sensingprovide data for GI Systems. • GI Systems allow the effective use of GPS and RS data. GPS data RS data GI Systems
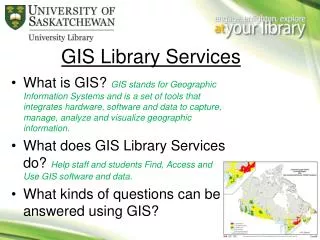
Geographic Information System: intuitive description A map with a database behind it Which you can use: • to support on-going operations • Where are my delivery vehicles now? • to make strategic decisions • Where shall I locate my new store • to conduct scientific inquiry • Are grocery prices higher in low income neighborhoods?
Management Information Systems and Geographic Information Systems What’s the difference? In practice, they are becoming more and more the same, but lets look at the classic differnece
The Uniqueness of GISuses explicit location on earth’s surface to relate data SS # But I don’t have a SS # !! We all have Latitude and Longtitude !! Everything happens someplace. Is there anything more in common? “Allows the integration of disparate data hitherto confined to separate domains” --allows you to bring stuff together that you couldn’t before --customer’s homes and store locations --polluted rivers and factory locations
The GIS Data Model: A layer-cake of information • Each layer is a different phenomena • elevation, streets, ownership parcels, land use • Layer are related based on common geographic coordinates • Latitude & longitude or projected X,Y coordinates
Two data types: Vector and Raster “raster is faster but vector is corrector” Real World Raster Representation Vector Representation point line polygon
0 1 2 3 4 5 6 7 8 9 1 1 1 1 1 4 4 5 5 5 0 1 1 1 1 1 4 4 5 5 5 1 1 1 1 1 1 4 4 5 5 5 2 1 1 1 1 1 4 4 5 5 5 3 1 1 1 1 1 4 4 5 5 5 4 2 2 2 2 2 2 2 3 3 3 5 2 2 2 2 2 2 2 3 3 3 6 2 2 2 2 2 2 2 3 3 3 7 2 2 4 4 2 2 2 3 3 3 8 2 2 4 4 2 2 2 3 3 3 9 Multi-family retail Single family industry retail Representing Data with Raster and Vector Models 1. Raster Model • area is covered by grid of equal-sized, square cells (usually) • each cell given a single value based on the majority feature in the cell, such as land use type.
0 1 2 3 4 5 6 7 8 9 1 1 1 1 1 4 4 5 5 5 0 1 1 1 1 1 4 4 5 5 5 1 1 1 1 1 1 4 4 5 5 5 2 1 1 1 1 1 4 4 5 5 5 3 1 1 1 1 1 4 4 5 5 5 4 2 2 2 2 2 2 2 3 3 3 5 2 2 2 2 2 2 2 3 3 3 6 2 2 2 2 2 2 2 3 3 3 7 2 2 4 4 2 2 2 3 3 3 8 2 2 4 4 2 2 2 3 3 3 9 Brown Lee Smith Santos Lee Representing Data with Raster and Vector Models Raster Model • Great for some data such as elevation, rainfall, land use • environmental data in general • Doesn’t work so well for others such as land ownership, streets, • human data in general
Representing Data with Raster and Vector Models 5 1 2 II Birch Smith Estate I A34 III A35 6 4 Cherry IV 3 Vector Model Features in the real work can be represented either as: • points (nodes): intersections, stores, homes, trees, poles, fire plugs, airports, cities • lines (arcs): streets, sewers, streams • areas (polygons): land parcels, voting precincts, cities, counties, forest, rock type More complex, but more accurate and flexible
Example 2 vector Layers Street Network layer: lines Land Parcels layer: polygons Raster layer (image) Digital Ortho Photograph Digital Ortho photo: visual properties of a photograph with the positional accuracy of a map, in computer readable form.
Analysis Parcels within a half mile buffer of Park and Central Data Table
Real estate sales and pricesDallas area, year on year 1st Q 2014 Source: Dallas Morning News Friday April 18, 2014, p. 7D
Interactive database—click on Richardson http://www.dallasnews.com/business/databases/20140417-area-home-sales.ece
Real estate sales and pricesDallas area, year on year 1st Q 2014Color-coded or Choropleth map Source: Dallas Morning News Friday April 18, 2014, p. 1D
Real estate sales pricesAnalysis Prices down cluster 21 Coppell 26 Irving 17 Oak Lawn Prices upcluster 14 Oak Cliff 15 Southern Dallas 13 Southeast Dallas 4 Wilmer-Hutchins Analysis: Why? Source: Dallas Morning News Friday April 18, 2014, p. 1D
Market Area Analysis using GIS for Pottsboro Regional Library Competitors (other libraries) Demographic Data (potential market) Data from ESRI, Inc. ArcGIS Business Analyst
Information on competitors GIS: map with a database behind it.
Location of library card holders, Pottsboro Area Public Library, Overlay of city boundaries November, 2013
Demographic data on our market area: --data by census block --use to calculate market penetration
Population in each census block group: --need to add count of our customers
Points in polygon operation --counts the number of points falling in each polygon --the number of customers in each block group Achieved with a spatial join --join points file to polygon file Calculate market penetration --now have population and count of customers for each block group we can calculate market penetration as: Customer Count / Total Population*100
Spatial join adds Count of customers for each polygon Market Penetration calculated as: MarkPen = Count (of customers)/2012 Total Population*100
Creating a color coded (choropleth) map for market penetration
73% is a remarkably successful market penetration! Data problem! 657 patrons have only zip code for address --all geocoded to same location 96.697 33.797
657 patrons geocoded to here (center point for 75076) But could live anywhere in here (75076 zip code area)
In God we trust, all others bring data. Michael Bloomberg In God we trust, all others bring good data.
Voting sites reduced from 54 in 2010 to 36 in 2012 to 22 in 2013 • but could vote at any site in 2013 • No analysis done • Would this increase distances voters had to travel? • Would it differentially impact minorities?
Data for all census blocks in Grayson County (6,705) for total population, voting age population, and four racial/ethnic groups • Use GIS to calculate average travel distance to • 54 local precinct voting sites in 2010 • 36 local precinct voting sites in 2012 • 22 closest voting site (irrespective of precinct) in 2013
Comparing results for 2012 (36 sites) when had to vote at your site, to 2013 (22 sites) when vote at any site • average travel distances went down (negative values for change) • flexbility of going to any site offset the smaller number of sites (22 rather than 36) • African Americans the sole exception • Travel distance increased by 7.8% • But only 484 feet in absolute terms
Thiessen (Voroni) polygons:--the area closer to a point than to any other point--a store’s “natural” trade area Source: Jesse K. Pearson A Comparative Business Site-Location Feasibility Analysis using GIS Systems and the Gravity Model Department of Resource Analysis, Saint Mary’s University of Minnesota, Minneapolis, MN
Thiessen polygons: applications • Calculate customer potential in each area polygon • Do each of your stores have similar penetration • Are there laggards? • consider new stores at intersection of polygons with large customer potential
Drive-time analysis for store locations:commonly used to assess the potential of different possible sites
Maximal coverage models Given • A set of demand polygons (7) • A set of potential sites (9) Where locate three facilities • to maximize sales (stores) • to minimize travel distance (fire stations) Source: Church and Murray 2008
GIS and Social Media Matthew Zook, et. al. "The Geography of Beer.” Department of Geography, University of Kentucky Tweets sent between June 2012 and May 2013 were searched for keywords pertaining to beer. Geotagging allowed the tweets to be located on a map http://www.livescience.com/44622-beer-on-twitter-finding-drinking-patterns-in-tweet-data-infographic.html
Thank you for inviting meQuestions? briggs@utdallas.edu www.utdallas.edu/~briggs (under Presentations)
Resources: books and papers Richard L. Church, Alan T. Murray Business Site Selection, Location Analysis and GIS Wiley InterScience On-line, ISBN: 9780470432761, 2008 Miller, F. GIS tutorial for marketing. Redlands, CA: ESRI Press, 2007 Miller, F. Getting to Know ESRI Business Analyst. Redlands, CA: ESRI Press, 2010 Pick, James B. Geo-Business: GIS in the Digital Organization. Wiley, 2008 Boyles, David. GIS means business, Redlands, CA: ESRI Press, 2002 Grant Thrall, Business Geography and New Real Estate Market Analysis (Oxford: Oxford University Press, 2002) Shepherd, Ian D. H. From Geography Department to Business School: Strategies for Transplanting GIS Courses between Disciplines Journal of Geography in Higher Education, 2009, Vol.33(1), p.28-45 http://www.gis.smumn.edu/GradProjects/RingoL.pdf Linder G. Ringo Utilizing GIS-Based Site Selection Analysis for Potential Customer Segmentation and Location Suitability Modeling to Determine a Suitable Location to Establish a Dunn Bros Coffee Franchise in the Twin Cities Metro, Minnesota Department of Resource Analysis, Saint Mary’s University of Minnesota, Minneapolis MN
Resources: on-line examples http://www.gis.smumn.edu/GradProjects/RingoL.pdf Linder G. Ringo Utilizing GIS-Based Site Selection Analysis for Potential Customer Segmentation and Location Suitability Modeling to Determine a Suitable Location to Establish a Dunn Bros Coffee Franchise in the Twin Cities Metro, Minnesota Department of Resource Analysis, Saint Mary’s University of Minnesota, Minneapolis MN http://www.gis.smumn.edu/GradProjects/PearsonJ.pdf Jesse K. Pearson A Comparative Business Site-Location Feasibility Analysis using GIS Systems and the Gravity Model Department of Resource Analysis, Saint Mary’s University of Minnesota, Minneapolis, MN