Download
1 / 7
70 likes | 187 Vues
Millennium Development Goals (MDG) Indicators on Employment, Philippines: 1999-2010 (In percent). GOAL 1: ERADICATE EXTREME POVERTY AND HUNGER Target 1.B: Achieve full and productive employment and decent work for all, including women and young people

E N D
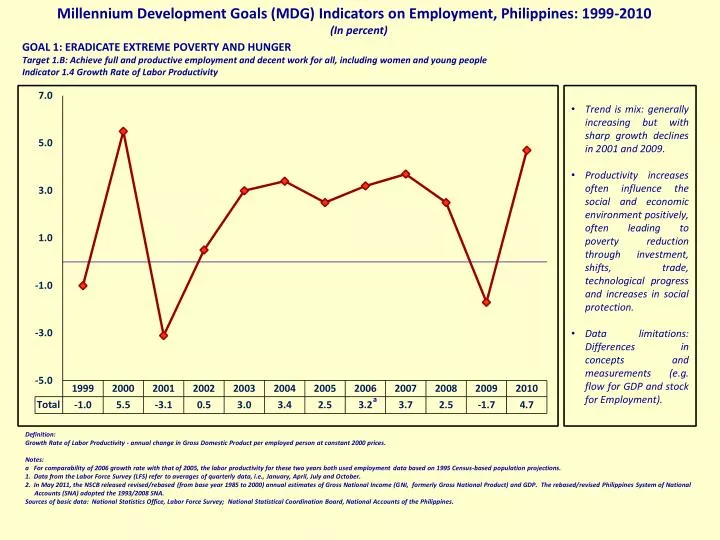
Millennium Development Goals (MDG) Indicators on Employment, Philippines: 1999-2010 (In percent) GOAL 1: ERADICATE EXTREME POVERTY AND HUNGER Target 1.B: Achieve full and productive employment and decent work for all, including women and young people Indicator 1.4 Growth Rate of Labor Productivity • Trend is mix: generally increasing but with sharp growth declines in 2001 and 2009. • Productivity increases often influence the social and economic environment positively, often leading to poverty reduction through investment, shifts, trade, technological progress and increases in social protection. • Data limitations: Differences in concepts and measurements (e.g. flow for GDP and stock for Employment). a Definition: Growth Rate of Labor Productivity - annual change in Gross Domestic Product per employed person at constant 2000 prices. Notes: a For comparability of 2006 growth rate with that of 2005, the labor productivity for these two years both used employment data based on 1995 Census-based population projections. 1. Data from the Labor Force Survey (LFS) refer to averages of quarterly data, i.e., January, April, July and October. 2. In May 2011, the NSCB released revised/rebased (from base year 1985 to 2000) annual estimates of Gross National Income (GNI, formerly Gross National Product) and GDP. The rebased/revised Philippines System of National Accounts (SNA) adopted the 1993/2008 SNA. Sources of basic data: National Statistics Office, Labor Force Survey; National Statistical Coordination Board, National Accounts of the Philippines.
Millennium Development Goals (MDG) Indicators on Employment, Philippines: 1990-2010 (In percent) GOAL 1: ERADICATE EXTREME POVERTY AND HUNGER Target 1.B: Achieve full and productive employment and decent work for all, including women and young people Indicator 1.5 Employment-to-Population Ratio • Trends stagnant through out the last two decades, except for a sharp decline in 2000. This implies that employment (labor demand) is growing at the same pace with population growth (labor supply) • Ratios higher for men than women. Trend for men declining slightly; trend for women increasing slightly. • . • Right direction: employment growth should exceed population growth. However, job gains should be well-paid, productive and secure (decent work). • Ratio should not be too high. Above 80% often occur in very poor countries and usually indicate an abundance of low quality jobs. • In rich countries, the ratio is lower as people can afford not to work as those who do have higher productivity and incomes. Fewer workers are required to meet the needs of the entire population. Definition: Employment-to-Population Ratio - proportion of household population 15 years old and over that is employed. Notes: 1. Data from the Labor Force Survey (LFS) refer to averages of quarterly data, i.e., January, April, July and October except for 1990 which is the average of January, July and October data as April round not conducted due to 1990 Population Census. 2. LFS data from 1990-1996 were adjusted based on the 1980 Census-based population projections, those from 1997-2005 were adjusted based on the 1995 Census-based population projections and those from 2006 onwards were adjusted based on the 2000 Census-based population projections. Source of basic data: National Statistics Office, Labor Force Survey.
Millennium Development Goals (MDG) Indicators on Employment, Philippines: 1997-2006 (In percent) GOAL 1: ERADICATE EXTREME POVERTY AND HUNGER Target 1.B: Achieve full and productive employment and decent work for all, including women and young people Indicator 1.6 Working Poverty Rate • Trends erratic and generally increasing . • Rates higher for men than women. Trends almost identical for both groups, i.e., the increase in the rates cut across men and women. • Working poverty gives an indication of the lack of decent work: if the work of individuals do not even provide incomes high enough to lift them and their families out of extreme poverty, then these jobs, at the very least, do not fulfill the income component of decent work. The data were computed based on the old methodology for estimating poverty. Definition: Working Poverty Rate - proportion of working poor in total employment. Working poor are employed persons living in a household whose members are estimated to be below the national poverty threshold. This is calculated on the basis of cross-tabulations of data sets of the Family Income and Expenditures Survey (that includes the variable on poverty status) conducted every three (3) years and the Labor Force Survey. The data were computed based on the old methodology for estimating poverty. Source of basic data: National Statistics Office, Merged files of the Family Income and Expenditures Survey and Labor Force Survey.
Millennium Development Goals (MDG) Indicators on Employment, Philippines: 1990-2010 (In percent) GOAL 1: ERADICATE EXTREME POVERTY AND HUNGER Target 1.B: Achieve full and productive employment and decent work for all, including women and young people Indicator 1.7 Proportion of Self-employed and Unpaid Family Workers in Total Employment (Vulnerable Employment Rate) • Trends declining over time. • Rates higher for men than women . Rates declined faster for men than for women. • An indication of the size of employment in the informal sector. • Need to promote “wage employment “ – generally more “decent job”. • Self-employment is not bad per se - but programs should address the issues of “lack of social protection and safety nets”. • Based on SSS records of active self-employed members: 632,000 or 5.9% of 10.724 million self-employed in 2009, down from 670,000 or 6.3% of 10.654 million the previous year. Notes: 1. Data from the Labor Force Survey (LFS) refer to averages of quarterly data, i.e., January, April, July and October except for 1990 which is the average of January, July and October data as April round not conducted due to 1990 Population Census. 2. LFS data from 1990-1996 were adjusted based on the 1980 Census-based population projections, those from 1997-2005 were adjusted based on the 1995 Census-based population projections and those from 2006 onwards were adjusted based on the 2000 Census-based population projections. 3. In ILO status in employment, the self-employed and unpaid family workers are classified as own-account workers and contributing family workers, respectively. Source of basic data: National Statistics Office, Labor Force Survey.
Millennium Development Goals (MDG) Indicators on Employment, Philippines: 1990-2010 (In percent) GOAL 1: ERADICATE EXTREME POVERTY AND HUNGER Target 1.B: Achieve full and productive employment and decent work for all, including women and young people Indicator 1.7a Proportion of Self-employed in Total Employment Notes: 1. Data from the Labor Force Survey (LFS) refer to averages of quarterly data, i.e., January, April, July and October except for 1990 which is the average of January, July and October data as April round not conducted due to 1990 Population Census. 2. LFS data from 1990-1996 were adjusted based on the 1980 Census-based population projections, those from 1997-2005 were adjusted based on the 1995 Census-based population projections and those from 2006 onwards were adjusted based on the 2000 Census-based population projections. 3. In ILO status in employment, the self-employed workers are classified as own-account workers. Source of basic data: National Statistics Office, Labor Force Survey.
Millennium Development Goals (MDG) Indicators on Employment, Philippines: 1990-2010 (In percent) GOAL 1: ERADICATE EXTREME POVERTY AND HUNGER Target 1.B: Achieve full and productive employment and decent work for all, including women and young people Indicator 1.7b Proportion of Unpaid Family Workers in Total Employment Notes: 1. Data from the Labor Force Survey (LFS) refer to averages of quarterly data, i.e., January, April, July and October except for 1990 which is the average of January, July and October data as April round not conducted due to 1990 Population Census. 2. LFS data from 1990-1996 were adjusted based on the 1980 Census-based population projections, those from 1997-2005 were adjusted based on the 1995 Census-based population projections and those from 2006 onwards were adjusted based on the 2000 Census-based population projections. 3. In ILO status in employment, unpaid family workers are classified as contributing family workers. Source of basic data: National Statistics Office, Labor Force Survey.
Millennium Development Goals (MDG) Indicators on Employment, Philippines: 1990-2010 (In percent) GOAL 3: PROMOTE GENDER EQUALITY AND EMPOWER WOMEN Target 3.A: Eliminate gender disparity in primary and secondary education preferably by 2005, and in all levels of education no later than 2015 Indicator 3.2 Share of Women in Wage Employment in the Non-agricultural Sector • Trend increasing over time. • Indicates entry of women into more productive or remunerative employment. Definition: Share of Women in Wage Employment in the Non-agricultural Sector - share of female workers in wage and salary employment in the non-agricultural sector expressed as a percentage of total wage and salary employment in the non-agricultural sector. Notes: 1. Data from the Labor Force Survey (LFS) refer to averages of quarterly data, i.e., January, April, July and October except for 1990 which is the average of January, July and October data as April round not conducted due to 1990 Population Census. 2. LFS data from 1990-1996 were adjusted based on the 1980 Census-based population projections, those from 1997-2005 were adjusted based on the 1995 Census-based population projections and those from 2006 onwards were adjusted based on the 2000 Census-based population projections. Source of basic data: National Statistics Office, Labor Force Survey.