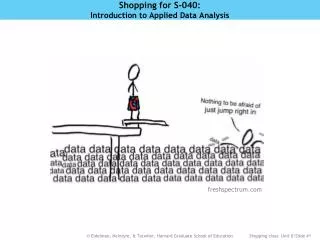
Shopping for S-040: Introduction to Applied Data Analysis
130 likes | 332 Vues
Shopping for S-040: Introduction to Applied Data Analysis. freshspectrum.com. A brief history of statistics at HGSE. Fall semester:. Spring semester:. S-012, full semester. S-030, full semester. OR. … and then the following Fall:. S-010Y, half-semester. S-052, full semester.

Shopping for S-040: Introduction to Applied Data Analysis
E N D
Presentation Transcript
Shopping for S-040: Introduction to Applied Data Analysis freshspectrum.com
A brief history of statistics at HGSE Fall semester: Spring semester: S-012, full semester S-030, full semester OR … and then the following Fall: S-010Y, half-semester S-052, full semester
S-040 is born! Couldn’t we do this in one semester, to give students the opportunity to take an intermediate methods class in the Spring of their first (or only) year? Enter Katherine Masyn! S-010Y + S-030 = S-040
A simple survey Thinking back over all the journal articles & research reports you read in your prior courses or professional work, in what percentage of papers did you carefully read the methods section? • All (100%) • Most (75-99%) • Many (50-74%) • Some (25-49%) • A Few (1-24%) • None (0%) And across all the methods sections you read, in what percentage did you understand what the researchers did well enough to critically evaluate the credibility of the results? • All (100%) • Most (75-99%) • Many (50-74%) • Some (25-49%) • A Few (1-24%) • None (0%) Do you plan on taking S-052, or another course which requires S-030 or S-040, in the spring?
Are people less judgmental when they’re primed to feel clean? Researchers found that people who are primed to feel clean are less severe in their moral judgments. ? But a replication study found no effect of priming clean thoughts on severity of moral judgments. the difference between not finding an association and finding that there is no association how two different studies can reach different conclusions, even if both of them are well-designed In class we’ll learn … why we want you to wash your hands before filling out your course evaluations
Do all-nighters really not improve grades? n=120 undergraduate students Those who never stayed up all night studying had an average GPA of 3.1 Predictor: Had they stayed up all night studying, or had they not? Those who had stayed up all night studying had an average GPA of 2.9 Outcome: Grade point average (possible range of 0-4) Time Magazine reports: “A new survey says those who never study all night have slightly higher GPAs than those who do.” So, do all-nighters really not improve grades? Maybe… BUT: Are we sure about the direction of the causal arrow?
Was ABC News really beating NBC news in the ratings race? 9.69 million 9.65 million “… for the four-week period … Mr. Gibson’s broadcast was seen by an average of 9.69 million viewers a night, about 43,000 more than the 9.65 million who watched Mr. Willams’ newscast.” So, was ABC really beating NBC? Maybe… BUT: These estimates are well within the limits of sampling error… Survey of 5,000
What you’ll learn in S-040: The science and art of data analysis and linear regression The basics Unit 1: The Basics: Categorical Variables Unit 2: The Basics: Continuous Variables Unit 3: Correlation and Causation Building a solid foundation Unit 4: Introduction to Simple Linear Regression Unit 5: Inference for the Regression Model Unit 7: Transformations to Achieve Linearity Unit 6: Regression Assumptions: Evaluating their Tenability Mastering the subtleties Unit 9: Multiple Regression in Depth: Special Topics Adding additional predictors Unit 8: The Basics of Multiple Regression Generalizing to other types of predictors and effects Unit 10: Categorical Predictors I: Dichotomies Unit 11: Categorical Predictors II: Polychotomies Unit 12: Interaction and Quadratic Effects Unit 14: Regression in Practice and Common Extensions Pulling it all together
By the end of this course, you will be able to Quantify the association between two variables Do the same while holding constant, or controlling for, a third variable Test for and interpret statistical interactions Draw inferences from a sample to a wider population Read, understand, and critique the methods sections of a wide variety of analyses Conduct a principled analysis of quantitative data from beginning to end Communicate your results to a wide variety of audiences, including academic and lay Take S-052 (Applied Data Analysis) or A-164 (Program Evaluation)
How you’ll spend your time in S-040, Part I:What we’ll do in class Each unit has a three-part structure Lectures with your questions: Active participation is encouraged (and often a great part of the learning experience) I. Research Questions and Data Sets • What is the relationship between median home values and MCAS pass rates? • Did Al Gore really lose the 2000 Presidential Race in Florida? • Are there racial disparities in the lengths of criminal sentences among convicted felons? • … and many more II. Delve into the new statistical content that the RQs (and the unit) demands • What aspect of the model do we need to learn more about? • How do we represent this aspect of the model algebraically & graphically? • What assumptions are we making (and how do we evaluate whether these make sense?) Note-taking: On laptop or printouts of handouts Please be courteous: No cellphones; keep email, web surfing, Facebook, etc., to an absolute minimum (so as not to distract classmates) III. Interpreting & presenting results • How do we interpret computer output? • What conclusions can we draw—and what conclusions don’t necessarily follow? • How do we write up our results—in words, graphs, tables, PowerPoints? • How do we communicate results to both technical and non-technical audiences?
How you’ll spend your time in S-040, Part II:What you’ll do outside of class Partnerships, Individuals, and Group Work • Work in study groups as you’d like, but write and submit HWs and the final with your one partner only • We will let you know which problem sets are individuals-only and which ones require a partner TFs will hold 1.5-hour labs each week, to support Stata coding and core concepts of the course Assignments • Six carefully constructed homework assignments, each consisting of a RQ, data set, & questions that guide you through a complete analysis (~50% grade) • Several problem sets, which will be relatively short in comparison to the homework assignments (~25% grade) • One final project that gives you a chance to pull together all your component skills into a polished professional product (~25% grade) Very little required reading: … available in your iPac … Statistical computing with TF support Course website: http://isites.harvard.edu/icb/icb.do?keyword=k106039
Eight things you should do before the first class meeting, next Thursday 1. Make sure you email Joe to get instructor permission to take this course. If you are a cross-registrant, check in with us on next steps. 3. Register for the course 7. Decide how you want to access Stata • Read through the “Statistical computing” section of the syllabus. • Think about whether it makes sense for you to purchase a license. 4. Read the School’s policy on plagiarism All written work submitted is to be in your own words 5. Familiarize yourself with theS-040 iSite • Bookmark the site. • Read the syllabus — it includes many more details and is our learning contract. 2. Complete and submit the sign up sheet (if by email, send to Hadas) 8. Bring the first handout to class (print or download) • We’ll be posting the 1st handout to the website by next Wednesday morning. • You don’t have to read it; just be sure to bring it. 6. Read “Best Practices in S-040” Helpful advice from former students and TFs