Download
1 / 32
320 likes | 492 Vues
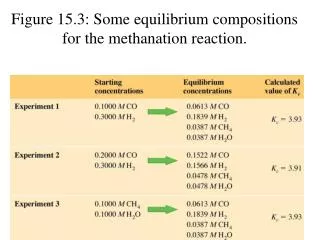
INSTRUCTIONS FOR THE NEXT FOUR AE SLIDES. We will start at $500 equilibrium GDP on each. Of the three items (equilibrium GDP, change in expenditures, and MPC), you will be given two and if you know two you can always figure out the 3 rd . For instance if you knew that

E N D
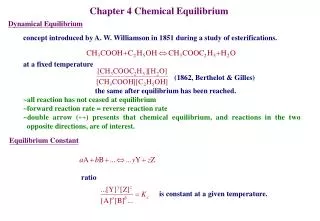
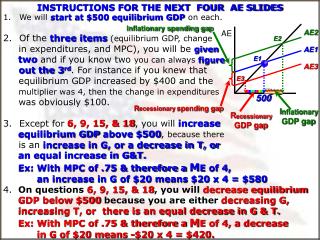
INSTRUCTIONS FOR THE NEXT FOUR AE SLIDES • We willstart at $500 equilibrium GDPon each. • Of the three items(equilibrium GDP, change • in expenditures, and MPC), you will be given • two and if you know two you can always figure • out the 3rd. For instance if you knew that • equilibrium GDP increased by $400 and the • multiplier was 4, then the change in expenditures • was obviously $100. • Except for 6, 9, 15, & 18, you will increase • equilibrium GDPabove $500, because there • is an increase in G, or a decrease in T, or • an equal increase in G&T. • Ex: With MPC of .75 & therefore a ME of 4, • an increase in G of $20 means $20 x 4 = $580 • 4. On questions 6, 9, 15, & 18, you will decrease equilibrium • GDP below $500 because you are either decreasing G, • increasing T, or there is an equal decrease in G & T. • Ex: With MPC of .75 & therefore a ME of 4, a decrease • in G of $20 means -$20 x 4 = $420. Inflationary spending gap AE AE2 AE1 AE3 E2 E1 E3 500 Recessionary spending gap Inflationary GDP gap Recessionary GDP gap
The Multiplier & Equilibrium GDP [Give the correct equilibrium GDP [start from $500] using the ME, MT, MBB] MT = MPC/MPS [Chg in T ] MBB = 1 [G&T ] ME=1/MPS [chg in G, Xg, or Xn] [+G] 1. ME = ____ [-T] 2. MT = ____ [+G&T] 3. MBB =____ 540 S 520 Inflationary Spending gap AE1 AE2 AE3 AE E2 520 E1 Chg in Equilibrium GDP ___ Y with ME ____Y with MT ____Y withMBB 40 E3 20 20 ME__ MT___ MBB___ 2 MPC [So MPS & ME, MT, & MBB] $20 Change in Expenditures $500 Recessionary Spending gap .50 1 1 [+G] 1. ME = ____ [-T] 2. MT = ____ [+G&T] 3. MBB =____ MT’s MPC M .90 = 9 .87.5= 7 .80 = 4 .75 = 3 .60 =1.5 .50 = 1 ME’s [G,Ig,Xn] MPC M .90 = 10 .87.5= 8 .80 = 5 .75 = 4 .60 =2.5 .50 = 2 [+G] 1. ME = ____ [-T] 2. MT = ____ [+G&T] 3. MBB =____ [+G] 1. ME = ____ [-T] 2. MT = ____ [+G&T] 3. MBB =____ 600 700 560 590 548 650 510 512 550 2 3 1 $100 Y with ME ___Y with MT ___Y withMBB $200 Y with ME _____Y with MT _____Y withMBB ____ Y with ME ____Y with MT ____Y withMBB 60 90 150 48 10 50 12 ME__ MT___ MBB___ ME__ MT___ MBB___ .9 10 5 ME__ MT___ MBB___ 4 $10 .80 $12 4 9 .75 3 $50 ? 1 1 1
[-G] 1. ME = ___ [+T] 2. MT =___ [-G&T]3.MBB=___ [+G] 1. ME = ____ [-T] 2. MT = ____ [+G&T] 3. MBB =____ 600 [+G] 1. ME = ____ [-T] 2. MT = ____ [+G&T] 3. MBB =____ 550 460 550 465 530 550 520 495 4 5 ___ Y with ME ____Y with MT ____Y with MBB 50 6 100 ___ Y with ME ____Y with MT ____Y with MBB -40 ___ Y with ME ____Y with MT ____Y with MBB 30 50 -35 20 50 -5 .60 .50 87.5 2 2.5 ME__ MT___ MBB___ ME__ MT___ MBB___ 8 ME__ MT___ MBB___ $20 1 $50 1.5 7 -$5 1 1 1 [-G] 1. ME =___ [+T] 2. MT =___ [-G&T]3.MBB=___ 575 [+G] 1. ME = ____ [-T] 2. MT = ____ [+G&T] 3. MBB =____ [+G] 1. ME = ____ [-T] 2. MT = ____ [+G&T] 3. MBB =____ 300 900 560 320 800 515 480 600 7 8 9 -200 75 ___ Y with ME ____Y with MT ____Y with MBB ___ Y with ME ____Y with MT ____Y with MBB ___ Y with ME ____Y with MT ____Y with MBB 400 60 -180 300 15 100 -20 .80 .9 .75 5 10 ME__ MT___ MBB___ 4 ME__ MT___ MBB___ ME__ MT___ MBB___ $15 4 -$20 9 $100 3 1 1 1
[+G]1.ME= ___ [-T]2.MT=___ [+G&T]3.MBB=___ [+G] 1. ME = ____ [-T] 2. MT = ____ [+G&T] 3. MBB =____ 540 [+G] 1. ME = ____ [-T] 2. MT = ____ [+G&T] 3. MBB =____ 512.5 550 538 540 507.5 502 505 510 10 11 __._ Y with ME _.___Y with MT __ with MBB 125 12 40 ___ Y with ME ____Y with MT ____Y with MBB 50 ___ Y with ME ____Y with MT ____Y with MBB 75 38 40 50 2 10 .95 .60 ? ? 20 ME__ MT___ MBB___ 5 ME__ MT___ MBB___ 2.5 ME__ MT___ MBB___ $5 $2 $10 19 4 1.5 1 1 1 [-G] 1. ME =___ [+T] 2. MT =___ [-G&T]3.MBB=___ 560 [+G] 1. ME = ____ [-T] 2. MT = ____ [+G&T] 3. MBB =____ [+G] 1. ME = ____ [-T] 2. MT = ____ [+G&T] 3. MBB =____ 420 700 545 430 600 515 490 600 13 14 15 -80 60 ___ Y with ME ____Y with MT ____Y with MBB ___ Y with ME ____Y with MT ____Y with MBB ___ Y with ME ____Y with MT ____Y with MBB 200 45 -70 100 15 100 -10 87.5 .75 .50 8 4 ME__ MT___ MBB___ 2 ME__ MT___ MBB___ ME__ MT___ MBB___ $15 -$10 7 $100 3 1 1 1 1
532 [-G] 1. ME = ___ [+T] 2. MT =___ [-G&T]3.MBB=___ [+G] 1. ME = ____ [-T] 2. MT = ____ [+G&T] 3. MBB =____ 625 [+G] 1. ME = ____ [-T] 2. MT = ____ [+G&T] 3. MBB =____ 400 524 600 410 508 525 490 16 17 18 32 125 ___ Y with ME ____Y with MT ____Y with MBB -100 ___ Y with ME ____Y with MT ____Y with MBB ___ Y with ME ____Y with MT ____Y with MBB 24 100 -90 8 25 -10 .75 .80 .9 4 10 ME__ MT___ MBB___ 5 ME__ MT___ MBB___ ME__ MT___ MBB___ $8 $25 3 9 4 -$10 1 1 1
ME = 1/MPS MT= MPC/MPS MPC MT ME 2nd Round at .9 90% .910 9 2nd Round at .5 50% If Arlington gets a Super Bowl, it would have an estimated economic impact of $400 million. 200,000 people would visit the area. .85 4 .754 The 2000 Olympics resulted in $3 1/2 billion to Australia’s economy over a year’s time. The Texas-Oklahoma gamebrings $21 mil to D-FW. 2006 Cotton Bowl brought $30 million to D-FW. Super Bowl brought $336 million to Houston. Fiesta Bowl for national title brought in $85 million. Big 12 Tournament brought $45 million to D-FW 3 .602.5 1.5 .52 1 Notice the 2ndround with .9versus.5 The larger the MPC, the smaller the MPS, and the greater the multiplier. This is the “simple multiplier” because it is based on a“simple model of the economy”. OU
Super Bowl - $336 Million For Houston in 2004 • $150 - Parking ratesaround the stadium • $500-$600 per Super Bowl ticket [$2,000-$6,000on E-Bay for a seat] • $12,000 – cost ofSuper Bowltrophy • $2.3 million – 30 second ad • $50,000 – Super Bowl Ring • 68,000to each player on thewinning team • $36,500to each player on thelosing team. • $3.35 millionto thewinning team • $2.59 millionto thelosing team • Hotels - $69 M; bars & restaurants-$27 M; entertainment-$15M; transportation-$15 M; and retail sales-$41 M Reliant Stadium
Step by Step Working of “Multiplier” [MPC is .5] Government increases spending by$1 billion with a multiplier of 2 $1,000.00 500.00 250.00 125.00 62.50 31.25 15.625 7.8125 3.90625 1.953125 .9765625 .48828125 .244140625 .1220703125 .06103515625 .030517578125 .015258789062 $2,000,000,000 On new highways Highway workers buy new boats Boat builders buy plasma TVs TV factory workers buy new cars Auto workers buy “wife beater shirts” Apparel workers spend $ on movies Movie moguls spend money on Christina Agulera songs. “What A Girl Wants.” [Increased by a multiple of 2]
Let’s Go To Padre Island and Party With The Multiplier These are Texas A&M students at Padre. UT student • During spring break, college students like to head to Padre Island. The “multiplier” is getting ready to work. • With dollars in their pockets, the students spend money on food and drink, motel rooms, dance clubs, etc. These dollars raise total income there by some multiple of itself. • College students buy pizzas, beer, and sodas. The people who sell these items find their incomes rising. They spend some fraction of their increased income, which generates additional income for others. • If the students spend $8 million at Padre and the MPC is .60, then college students will increase income in Padre by $20 million. • When the networks show scenes on the beach, the average person simply sees college students having a good time. • But – economists see the multiplier at work, generating higher levels of income for many of the residents of Padre Island.
NS 7 – 10 7. The APC indicates the percent of total income that will be (consumed/saved). 8. The MPC is the fraction of a change in income which is (spent/saved). 9. The greater is the MPC, the (larger/smaller) the MPS, and the (larger/smaller) the multiplier. 10. With a MPS of .4, the MPC will be (.4/.2/.6) and the multiplier will be (2/2.5/4). Multiplier – As the money goes from one person, to another, to another…
Building AE 1 [C+Ig](private-closed) [C+Ig+Xn](private-open) [C+Ig+G+Xn](mixed-open) [From “Simple” to “Complex” economy] Private Closed Private Open Open Mixed “ME” = 4 S AE3(C+Ig+G+Xn) (Complex Economy) [Mixed-open] (AE3)630 AE2 (C+Ig+Xn) (Private-open)[X(10)-M(10)] AE1(C+Ig)[Basic Economy][Private(noG)-Closed(noX or M)] +20 G (AE2)550 (AE1)470 Consumption + Xn +20 Ig C=390 +80 +80 InjectionsLeakages 1. Investment [20]= 1. Saving[20] 2. Exports [10]=2. Imports[10] 3. Government [20]= 3. Taxes [20] 45 0 390470550 Real GDP Notice that the injections are autonomous (independent) of Y
How to figure the MPC & MPS [MPC = C/ Y][MPS = S/ Y] S SAVING D Consumption Consumption C2 C MPC=? BC/EF[or AB] A C1 B MPS=? CD/EF Dissaving 45 o F H E Disposable Income
o 45 Review S AE1[C+Ig] H $1,000 Consumption AE [C+Ig] $700 I J $400 P $100 2004001,000 bil. 0 N QK Real GDP Consumption will be equal to income at income level ? $400 With Ig[C+Ig],the MPC is? PI/QK The MPS is ? HI/QK What income level represents “dissaving”? $200
o 45 NS 11-16 D Consumption 11. The APC is one at letter (A/B/C/D). 12. The MPC is equal to (AE/OE or BC/EF[or AB]). [moving from OE(400) to OF(1,000)] 13. At income level “OF” the volume of saving is (CB/CD). 14. Consumption will be equal to income at incomelevel (OH/OE). 15. The economy isdissaving at income level (OH/OF). 16.The MPS is (CD/EF or CB/EF). [moving from OE to OF] 1,000 700 400 C C A B 200 400 1,000 0 F H E Income
An Increase in G of $20B is more expansionary than adecrease in T of $20 B [If the MPC is .75,ME is 4but theMT is only 3] Incr G spending by $20 bil. “ME” of 4 [1/.25] [20 x 4 = $80] S AE2(C+Ig+G) AE AE1(C+Ig) “Big 12” Tournament brings $45 million to the DFW economy. Let’s see, anyone’s spending (G,Ig, or Xn) becomes someone else’s income, so there will be an increase in “C”. +20G +80 YRF* 500 580 AAC “Tax cut” of $20 billion “MT” = 3 [.75/.25] x 20 = $60 S AE AE2 AE1 +20T +60 [Need a 25% larger “Tax cut” to get to $580] “Tax cut of $25.67 billion x 3 = $80] YRY* 500580 560
2000 1999 C = YD 1998 1997 1996 1995 1994 1993 1992 1991 1990 1989 1988 1987 1986 1985 1984 1983 1982 1981 1980 Actual consumer spending 45° U.S. Consumption and Income $7000 6000 5000 4000 CONSUMPTION (billions of dollars per year) 3000 2000 1000 [so, gives us APC] 0 $1000 2000 3000 4000 5000 6000 7000 DISPOSABLE INCOME (billions of dollars per year)
The Consumption Function:How large we expect the basic flow of consumer spending to be at different levels of GDP (income)
Dissaving During The Great Depression C/Y = $4,425/$4,800 = 92% 1993 Saving = $375.0 billion “C” = $4,425 “S” = $375 1929 – Saving = $4 bil. 1933 – Dissaving 1944 – Saving= 20%
Consumption Schedule [direct relationship between income & consumption] o 45 S S $530 510 490 470 450 430 410 390 370 Consumption Consumption(billions ofdollars) o 370 390 410 430 450 470 490 510 530 550 Disposable Income(billions of dollars)
Equilibriumin a Private-Closed [C+Ig] Economy Leakage (S of $20 B)= Injection (Ig of $20 B)
o 45 Equilibrium GDP after $20 bil. Ig [MPC=.75] AE[C+Ig][“Basic” or “Simple” economy] S C + Ig $530 510 490 470 450 430 410 390 370 Closed Private Consumption Equilibrium AE[C+Ig](billions ofdollars) Ig = $20 Billion C =$450 Billion + 20 Ig +80 o 370 390 410 430 450 470 490 510 530 550 Real domestic product, GDP (billions of dollars)
At Equilibrium, Any Injections = Any Leakages Injections = Leakages C+IgIg(20)=S(20) [Private-closed] C+Ig+XnIg(20)+X(10)=S(20)+ M(10) [Private-open] C+Ig+G+XnIg(20)+G(20)+X(10)=S(20)+T(20)+M(10) [Mixed-open]
Autonomousv.Induced Investment So Ig is said to be“forward looking”, based more on profit expectations, rather than current income. Investment induced by income (dependent” or “stimulated by Y” Autonomous Investment “Independent of” or “not stimulated by Y”
Volatility of Investment R R R R R R R
Reasons for Instability of Investment • Durability of Capital [can postpone] • Variability of Profits • Variability of Expectations • Irregularity of Innovation • [introduction of new products]
MULTIPLIER WITH PL CHANGES Inflation and the Multiplier [4] AS Full Multiplier Effect Reduced Multiplier Effect Due to Inflation AD3 AD2 AD1 +20 +20 Price Level P2 P1 + 40 bil. + 80 bil. GDP1 GDP2 GDP3 M(4)=chg.Y/chg.E [80] [20] M(2)=chg.Y/chg. E [40] [20]
Expansionary Fiscal Policy [MPS=.20] the multiplier at work... $5 billion initial direct increase in spending AS AD1 AD2 Full $25 billion increase in AD +5 Price level PL1 $475 500 Real GDP (billions)
Expansionary Fiscal Policy $5 billion initial direct increase in spending Reduced Multiplier Effect Due to Inflation AS AD2 AD2 AD1 +5 M = 4 20/5=4 Price level PL2 PL1 M = 5 25/5=5 $20 billion $25 billion 525 $500 520 Real GDP (billions)