Beware of Confounding Variables
190 likes | 818 Vues
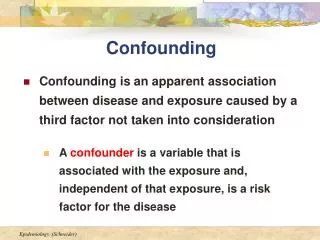
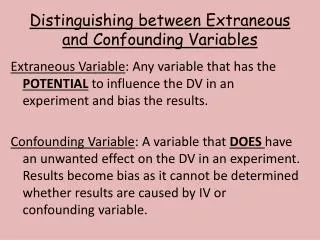
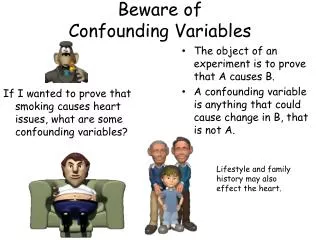
Beware of Confounding Variables. If I wanted to prove that smoking causes heart issues, what are some confounding variables?. The object of an experiment is to prove that A causes B. A confounding variable is anything that could cause change in B, that is not A.

Beware of Confounding Variables
E N D
Presentation Transcript
Beware ofConfounding Variables If I wanted to prove that smoking causes heart issues, what are some confounding variables? • The object of an experiment is to prove that A causes B. • A confounding variable is anything that could cause change in B, that is not A. • Lifestyle and family history may also effect the heart.
Random Assignment • Once you have a random sample, randomly assigning them into two groups helps control for confounding variables. • Experimental Group v. Control Group. • Group Matching
Hawthorne Effect • But even the control group may experience changes. • Just the fact that you know you are in an experiment can cause change. • Whether the lights were brighter or dimmer, production went up in the Hawthorne electric plant.
Experimenter Bias • Another confounding variable. • Not a conscious act. • Double-Blind Procedure.
Evaluating Research: Methodological Pitfalls • Sampling bias • Placebo effects • Distortions in self-report data: • Social desirability bias • Response set
REVIEW: • WHEN THE RESEARCHERS EXPECTATIONS ABOUT THE OUTCOME OF THE STUDY INFLUENCE THE STUDY? • EXPERIMENTER BIAS • WHEN PARTICIPANTS EXPECTATIONS LEAD THEM TO EXPERIENCE SOME CHANGE, EVEN THOUGH THEY RECEIVE A EMPTY OR FAKE TREATMENT? • PLACEBO EFFECT • THE TERM FOR SAMPLING THAT IS NOT REPRESENTATIVE OF THE POPULATION? • SAMPLING BIAS
Correlational Method • Correlation expresses a relationship between two variable. • Does not show causation. • As more ice cream is eaten, more people are murdered. • Does ice cream cause murder, or murder cause people to eat ice cream?
Types of Correlation Positive Correlation • The variables go in the SAME direction. Negative Correlation • The variables go in opposite directions. • Studying and grades hopefully has a positive correlation. • Heroin use and grades probably has a negative correlation.
Survey Method • Most common type of study in psychology • Measures correlation • Cheap and fast • Need a good random sample • Low-response rate
Naturalistic Observation • Watch subjects in their natural environment. • Do not manipulate the environment. • The good is that there is no Hawthorne effect. • The bad is that we can never really show cause and effect.
Correlation Coefficient • A number that measures the strength of a relationship. • Range is from -1 to +1 • The relationship gets weaker the closer you get to zero. Which is a stronger correlation? • -.13 or +.38 • -.72 or +.59 • -.91 or +.04