Download
1 / 10
100 likes | 236 Vues
35. 30. 25. 20. 15. 10. 5. 0. Supplemental Figure 1. a. b. 800. 40. 35. 600. 30. 25. pg/ml. [RNA Sample ] / [RNA 18S ] (x10-6). 400. 20. 15. 200. 10. 5. 0. 0. Alum. Alum+CpG. Alum+CpG+323. None. Alum+CpG. Alum+CpG+323. DC+Medium. DC+323. c. ng/ml. BM-DC.

E N D
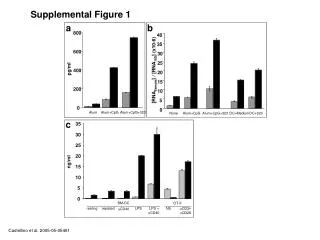
35 30 25 20 15 10 5 0 Supplemental Figure 1 a b 800 40 35 600 30 25 pg/ml [RNASample] / [RNA18S] (x10-6) 400 20 15 200 10 5 0 0 Alum Alum+CpG Alum+CpG+323 None Alum+CpG Alum+CpG+323 DC+Medium DC+323 c ng/ml BM-DC OT-II resting replated LPS LPS + aCD40 NS aCD3+ aCD28 aCD40 Castellino et al. 2005-05-05461
d 100 100 100 100 80 80 80 80 60 60 60 60 40 40 40 40 20 20 20 20 0 0 0 0 0 1 2 3 4 0 1 2 3 4 0 1 2 3 4 0 1 2 3 4 10 10 10 10 10 10 10 10 10 10 10 10 10 10 10 10 10 10 10 10 CCL3 CCL4 e CCL3 CCL4 Supplemental Figure 1 Castellino et al. 2005-05-05461
aSDF aCCL3 aCCL4 aCCL4 aSDF aCCL3 aCCL4 Supplemental Figure 1 f 180 25 160 140 20 120 15 100 80 CCL3 (pg/ml) CCL3 (pg/ml) 10 60 40 5 20 0 0 Pre-absorbed with: Pre-absorbed with: aSDF aCCL3 LN Supernatant Input material: rCCL3 (150 pg/ml) Input material: 120 700 600 100 500 80 400 CCL4 (pg/ml) CCL4 (pg/ml) 60 300 40 200 20 100 0 0 Pre-absorbed with: aSDF aCCL3 aCCL4 Pre-absorbed with: Input material: rCCL4 (500 pg/ml) LN Supernatant Input material: Castellino et al. 2005-05-05461
100 50 0 Supplemental Figure 2 a b c 50 80 80 40 60 60 30 % Total OT-I Migration % Total OT-I Migration % Total OT-I Migration 40 40 20 20 20 10 0 0 0 100 50 25 12 6 0 4 0.8 0 100 20 CCL4 (ng/ml) CCL4 (ng/ml) CCL19 (ng/ml) Castellino et al. 2005-05-05461
100 100 80 80 60 60 40 40 20 20 0 0 0 1 2 3 4 0 1 2 3 4 10 10 10 10 10 10 10 10 10 10 100 100 80 80 60 60 40 40 20 20 0 0 0 1 2 3 4 0 1 2 3 4 10 10 10 10 10 10 10 10 10 10 Supplemental Figure 3 a b Alum Alum + CpG Alum + CpG + 323 OT-I Endogenous CD8+ T cells c Alum + CpG + S 2m-/- + Alum + CpG 2m-/- + Alum + CpG + 323 Castellino et al. 2005-05-05461
Supplemental Figure 4 a b Castellino et al. 2005-05-05461
Supplemental Figure 5 a b Diffusive Chemotactic mode mode 25 80 20 60 15 CD (mm) CD (mm) 40 10 20 5 0 0 0 20 40 80 60 0 10 20 30 40 50 60 70 Distance from DC (mm) Furthest Point From DC (mm) Castellino et al. 2005-05-05461
a 35 30 Supplemental Figure 6 25 20 Frequency (%) 15 10 5 0 30 24 27 15 21 0 3 6 9 12 18 Instantaneous speed (mm/min) b c 50 60 50 40 40 30 Frequency (%) Frequency (%) 30 20 20 10 10 0 0 0 45 90 180 135 60 -90 -60 -30 30 90 0 180 Speed vector persistence angle Directional angle towards DC Castellino et al. 2005-05-05461
Supplemental Figure 7 a b 25 40 35 20 30 25 15 Frequency (%) Frequency (%) 20 10 15 10 5 5 0 0 0 2 4 6 8 10 12 14 16 18 20 22 24 26 28 >30 0 5 10 15 20 25 30 >30 16 Average track velocity (mm/min) Instantaneous speed (mm/min) Castellino et al. 2005-05-05461
Supplemental Table 1 Group BM-DC CD4+ T Cells CD8+ T Cell Kon (x10-6mm6hr-1)* DC** N*** Comments 1.38+0.04 5.22+0.13 pCD4 pCD8 0.89+0.05 MEDIUM 78 1 4 pCD4 72 0.95+0.05 1.36+0.06 MEDIUM pCD8 4.72+0.25 MEDIUM OT-II 82 OT-I 2 5 323 OT-II 114 OT-I pCD8 MEDIUM 371 OT-II 3 10 323 368 OT-II pCD8 22 pCD4 1.60+0.12 MEDIUM OT-I 4 4 pCD4 OT-I 82 323 3.93+0.11 1.46+0.07 MEDIUM OT-II WT pCD8 408 402 OT-II WT pCD8 323 5.34+0.31 9 5 MEDIUM CCR5-/- pCD8 1.82+0.24 408 OT-II 402 CCR5-/- pCD8 OT-II 323 2.07+0.28 1.06+0.07 66 MEDIUM OT-II pCD8 Control Ig 4 3.34+0.22 109 323 OT-II pCD8 6 93 MEDIUM 1.94+0.06 OT-II pCD8 4 aCCL3/4 72 2.06+0.13 323 OT-II pCD8 * average+s.e. **total number of DCs counted *** number of independent experiments Castellino et al. 2005-05-05461


