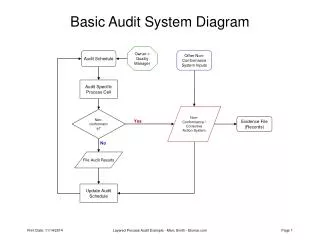
Basic Audit System Diagram
This document outlines a comprehensive approach to Layered Process Audits, detailing the audit system diagram owned by the Quality Manager. It emphasizes the schedule for audits, the management of non-conformance, and corrective action systems. The guide includes a proposed audit frequency ranging from 3 to 6 months, contingent on historical findings. Additionally, it provides examples of different audit areas, introduces a list of auditors categorized by management levels, and presents a generic process audit form to streamline audit procedures.

Basic Audit System Diagram
E N D
Presentation Transcript
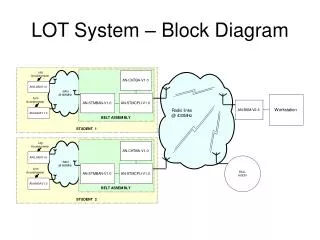
Basic Audit System Diagram Owner = Quality Manager Audit Schedule Other Non-Conformance System Inputs Audit Specific Process Cell Non- Conformance / Corrective Action System Non- conformance? Evidence File (Records) Yes No File Audit Results Update Audit Schedule Layered Process Audit Example - Marc Smith - Elsmar.com
Proposed Process Compartments Audit Area 1 Audit Area 3 Audit Area 5 Audit Area 4 Audit Area 2 Layered Process Audit Example - Marc Smith - Elsmar.com
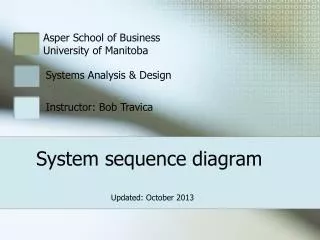
List of Auditors Sorted by Relative Level of Management • TS - President and CEO • PS - Vice-President • RH - CFO(Internal Audits) • DR - Quality Manager • TT - Quality Engineer • SM - Lead Process Supervisor • TE - Layout Technician • HB - Inspector • JH - Inspector Layered Process Audit Example - Marc Smith - Elsmar.com
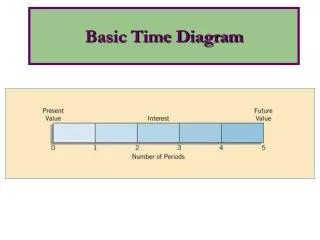
Initial Schedule Proposal Frequency = 6 Months Frequency = 4 Months Frequency = 3 Months Frequency may expand or compact depending upon audit findings. (Consideration of History) Layered Process Audit Example - Marc Smith - Elsmar.com
Process Audit Form Example This is a Generic Process Audit form. Layered Process Audit Example - Marc Smith - Elsmar.com