
E-Commerce Dashboard
E N D
Presentation Transcript
E-Commerce Dashboard By Wilson Tsang & HungJu Tze Thesis Supervisor: Professor Mark S. Fox
Overview • Introduction • Analysis • Design • Implementation • Future Development • Conclusion
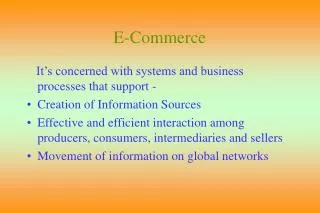
Background • The growth of e-Commerce activities has been phenomenal and is expected to increase even further
Motivation • While a classic website could survive with 95% availability, an E-Commerce solution could hardly last with a few hour of downtime in a week • Accurate measurement of e-Commerce Website’s performance is needed in order to make E-retailers profitable
Thesis Objectives • The E-Commerce dashboard is developed to do performance measurements • This will enable e-retailer to: • Review strategies • Spot abnormal state of website immediately • Restructuring their operations with trading partners • Become profitable and viable
Industrial Partner • Novator.com is the E-commerce solution provider • FTD.com is a website which sells flowers and gifts on the internet • E-commerce dashboard will be developed for both of them to measure performance of the website
Problems with Existing Solution • Poor structure of content • Information is not organized • Interpretation is needed to understand the information • The key performance indicators (KPIs) offered is insufficient for the E-Commerce situation
Requirements • Provide an intuitive interface by using EID (Ecological Interface Design) technique • Provide an interface that the user can spot any abnormal state in the E-Commerce quickly • Develop new KPIs based on the nature of E-Commerce environment to enhance the measurement of business performance
Work Domain Analysis • Define system boundary • Construct the system model • Derive information requirement from the system model
Key Performance Indicators • Visitor • Order • Revenue • Conversion rate • Average order value • Average time spent • Shopping carts abandon • Customer visit frequency • Popular product
User Evaluation of Prototype • Too much information shown. • Historical data should be added as a frame of reference. • More gadgets can be shown instead of tables.
New KPIs • Customer order frequency • Most accessed product • Most purchased product
Implementation I • Java and XML technology is chosen • Java is : • Portable • Object oriented • Easy to learn
Implementation II • Functionalities: • Reads required data from XML file • Processes data and transforms data into relevant information • Generates tables and graphs to display information in HTML form
Future Development • Ticktack Bar • Measuring Product Brand Value
Conclusion • Lack of performance measurement of e-Commerce Website often translates into lost revenues and customers • E-Commerce Dashboard will enable E-Retailer gain better understanding of their e-Commerce strategy and gain more profit
Thanks for your attention! Questions???