Relationship between A(OD) and %T
480 likes | 940 Vues
Relationship between A(OD) and %T. Transmittance , T = P / P 0 % Transmittance , %T = 100 T Absorbance , A = log 10 P 0 / P A = log 10 1 / T A = log 10 100 / %T A = 2 - log 10 %T . Beer Lamert’s Law. Reflection. Light scattering. reflection. scattering.

Relationship between A(OD) and %T
E N D
Presentation Transcript
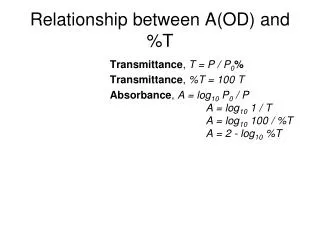
Relationship between A(OD) and %T Transmittance, T = P / P0% Transmittance, %T = 100 T Absorbance, A = log10P0/ P A = log10 1 / T A = log10 100 / %T A = 2 - log10 %T
reflection scattering For Solution: Scattering ~ 1/4
Prism Diffraction grating
Spectrophotometer types -Single beam-Dual beam-Diode array
Substrate (S) and enzyme (E) combine to form the enzyme/substrate complex (ES). The complex then dissociates to yield enzyme (E) plus product (P).
ELISA Enzyme-Linked Immunosorbent Assay
Buffer Dilution • V1 x C1 = Example: Need to make 1 L of 1mg/mL solution given 100mg/mL stock Example 2: Need to add component from 5.2x stock to 200mL of sample ? V2 x C2
Fluorescence is the emission of light by a substance that has absorbed light or other electromagnetic radiation of a different wavelength. George Gabriel Stokes named the phenomenon fluorescence in 1852. The name was derived from the mineral fluorite (calcium difluoride)
Factors that influence on Fluorescence pH Solid state or Solution state Solvent
Energy Absorbance Fluorescence Vibrational and rotational relaxation
The excitation and emission spectra of a fluorophore and the correlation between the excitation amplitude and the emission intensity. General diagram of the excitation and emission spectra for a fluorophore (left). The intensity of the emitted light (Em1 and Em2) is directly proportional to the energy required to excite a fluorophore at any excitation wavelength (Ex1 and Ex2, respectively; right).
The Stokes shift of the excitation and emission spectra of a fluorophore. Fluorophores with greater Stokes shifts (left) show clear distinction between excitation and emission light in a sample, while fluorophores with smaller Stokes shifts (right) exhibit greater background signal because of the smaller difference between excitation and emission wavelengths.
scattering Exitation reflection Emission
Spectrofluorometer Detector monochromator Emission Excitation
Microscope and Plate Reader Detector Filter Emission Excitation Dichroic Mirror
Filter and Dichroic Mirror http://www.chroma.com/products/catalog/11000_Series/11000v3
http://www.invitrogen.com/site/us/en/home/support/Research-Tools/Fluorescence-SpectraViewer.htmlhttp://www.invitrogen.com/site/us/en/home/support/Research-Tools/Fluorescence-SpectraViewer.html