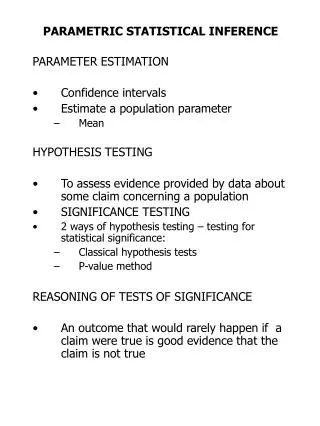
PARAMETRIC STATISTICAL INFERENCE
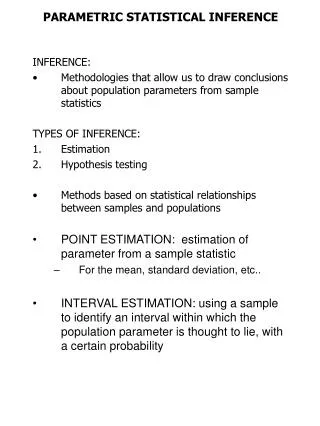
PARAMETRIC STATISTICAL INFERENCE. INFERENCE: Methodologies that allow us to draw conclusions about population parameters from sample statistics TYPES OF INFERENCE: Estimation Hypothesis testing Methods based on statistical relationships between samples and populations

PARAMETRIC STATISTICAL INFERENCE
E N D
Presentation Transcript
PARAMETRIC STATISTICAL INFERENCE INFERENCE: • Methodologies that allow us to draw conclusions about population parameters from sample statistics TYPES OF INFERENCE: • Estimation • Hypothesis testing • Methods based on statistical relationships between samples and populations • POINT ESTIMATION: estimation of parameter from a sample statistic • For the mean, standard deviation, etc.. • INTERVAL ESTIMATION: using a sample to identify an interval within which the population parameter is thought to lie, with a certain probability
ESTIMATION OF POPULATION MEAN • Sample mean value is only an estimate of the parameter mean value • Parameter value is not known • Due to sampling variability, no two samples will produce exactly the same outcome, or sample mean ·Can we estimate how this sample mean value would vary if you take many large samples from the same population? Remember: ·sample mean values from large samples have a normal distribution ·the mean of the sampling distribution is the same as the unknown parameter • standard deviation of for a SRS of size n is ?
PARAMETRIC STATISTICAL INFERENCE: ESTIMATION • Example: A random sample of 350 male college students were asked for the number of units they were taking. The mean was 12.3 units, with a standard deviation of 2.50 units. • What can we say about the mean number of units of all student males at the university? How will the estimate value of the parameter vary from one sample to another with a certain confidence, like 95%? Assume that = ?. s = ?
PARAMETRIC STATISTICAL INFERENCE: ESTIMATION Statistical confidence Remember: The 68-95-99.7 rule · In 95% of all samples, the mean score of x will lie within 2 standard deviations of the population mean score . Since s = 2.50, we can say that In 95% of samples, will lie within 5.0 points of the observed sample mean In 95% of all samples, • Thus, the parameter will lie between 7.3 and 17.3, in 95% of samples
PARAMETRIC STATISTICAL INFERENCE: ESTIMATION Rephrasing: 1.We are 95% confident that the interval 7.3-17.3 contains • We have just assigned statistical confidence to our estimation of the parameter • We call this estimated interval a CONFIDENCE INTERVAL for the mean value
PARAMETRIC STATISTICAL INFERENCE: ESTIMATION · But, there is still some chance that the true parameter value will not lie in the identified interval • e.g. The SRS chosen was one of few samples for which is not within 5.0 points of true mean. 5% of samples will give these incorrect results
PARAMETRIC STATISTICAL INFERENCE: ESTIMATION ·CONFIDENCE INTERVAL – formal definition A level C confidence interval for a parameter is defined as estimate margin of error and gives the interval that will capture the true parameter value in repeated samples with a certain probability ·Confidence intervals usually vary between 90% and 99.9%
PARAMETRIC STATISTICAL INFERENCE: ESTIMATION ·Constructing confidence intervals When we construct a 95% confidence interval, we are looking for two values for which there is a 95% chance that the population mean is between them. So, P(Low < < High) = 0.95 Thus, 0.95 = P(-1.96 < z < 1.96) = = = 0.95 =
PARAMETRIC STATISTICAL INFERENCE: ESTIMATION ·Draw a SRS of size n from a population having unknown mean , and known standard deviation . A level C confidence interval for This interval is exact when the population distribution is normal and is approximately correct for large n in other cases Z* = critical value of z – table C
Confidence intervals and confidence levels of Standardized normal curve N(0,1) Figure 6.5 and figure 6.6 C = chosen confidence level – probability that a parameter will lie within a given interval with a desired confidence (1-C)/2 = probability that a parameter will be situated either above or below the the lower confidence limit