Download
1 / 33
330 likes | 592 Vues
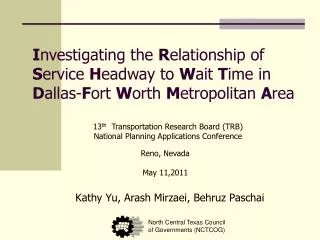
I nvestigating the R elationship of S ervice H eadway to W ait T ime in D allas- F ort W orth M etropolitan A rea. Kathy Yu, Arash Mirzaei, Behruz Paschai. North Central Texas Council of Governments (NCTCOG). B ackground.

E N D
Investigating the Relationship of Service Headway to Wait Time in Dallas-Fort Worth Metropolitan Area Kathy Yu, Arash Mirzaei, Behruz Paschai North Central Texas Council of Governments (NCTCOG) 13th Transportation Research Board (TRB) National Planning Applications Conference
Background • In an aggregate transit demand model, initial wait time and transfer wait time are set to: Wait Time = Min (0.5*Headway, Max_Wait) • Headway could be a combined headway (as it is defined in Optimal Strategy Algorithm). • Max_Wait is typically in the order of 15 to 30 minutes. 13th TRB National Transportation Planning Applications Conference
Problem • Misrepresentation of infrequent service in the model • Unrealistic wait time estimation in transit path builder • Drastic effect on mode choice estimation (estimation usually uses model outputs) • Magnitude of coefficients • Adding constraints on coefficients • Assert coefficients • Decrease quality of transit assignment 13th TRB National Transportation Planning Applications Conference
Objective Statistically measure or estimate the transit initial wait and transfer wait times for various types of service and trip purposes 13th TRB National Transportation Planning Applications Conference
Other Studies • O’Flaherty and Mangan (Leeds, 1970) • Seddon and Day (Leeds, 1974) • Fan and Machemehl (Austin, 2002) where : • E(w) = Expected value of wait time • E(h) = Expected value of service headway 13th TRB National Transportation Planning Applications Conference
Variability • Transit service variability caused by service reliability and unknown traffic conditions. • Passenger arrival variability created by trip-planning to minimize initial wait time. 13th TRB National Transportation Planning Applications Conference
Passenger Arrivals • Non-Random Arrivals • users of longer trips • longer service headways • regular users of transit services • plan their arrival based on the service headway • Random Arrivals • users of shorter trips • shorter service headways • do not necessarily plan their arrival, due to the frequent availability of transit vehicles 13th TRB National Transportation Planning Applications Conference
Wait Time • Wr = Wait time for a randomly arriving passenger • h = Bus headway • E() = Expected value of a random variable • V() = Variance of a random variable • Seddon and Day (Leeds, 1974) 13th TRB National Transportation Planning Applications Conference
Passenger Arrivals [4] [2] [4] [2] 13th TRB National Transportation Planning Applications Conference
Methods • Use of surveillance camera at the stations • Measures the wait accurately • Sampling and management challenges • Very labor intensive for the first study of wait time • Counting and time recoding of passengers at the stations • Measures the wait accurately • Sampling challenges • Labor intensive • Difficult to track passengers • Interview survey • Asks for the estimated wait • Sampling at the route level • Manageable for this first wait time study 13th TRB National Transportation Planning Applications Conference
Sample Size • Universe : DART bus and rail service, TRE • Stratification : based on service headways 10-15 30-45 Light Rail 15-20 >45 Commuter Rail 20-30 • Confidence interval : 90% • Total non-express bus samples : 500 • Total express bus samples : 170 • Total light rail samples : 65 • Total commuter rail samples : 170 13th TRB National Transportation Planning Applications Conference
Train Headway Variability 13th TRB National Transportation Planning Applications Conference
Route Selection • Rail Routes Selected • Light Rail (LRT): Red Line and Blue Line • Commuter Rail: TRE • Bus Routes Selected • 2 routes each from headway groups of 10-15, 15-20, 20-30, 30-45 , > 45 • Selection based on highest ridership, and overall coverage of service area. 13th TRB National Transportation Planning Applications Conference
Wait Time Questionnaire 13th TRB National Transportation Planning Applications Conference
Wait Time Study Details • Data collection started and ended in May 2009. • 1,933 completed surveys were received. The sample goals were reached. • 1,028 non-express bus, 321 express bus surveys • 392 LRT surveys • 192 TRE surveys • Initial and Transfer Wait Time Responses • 979 Initial Wait Time Responses • 954 Transfer Wait Time Responses 13th TRB National Transportation Planning Applications Conference
DART/TRE Results by Headway Group * Wait Time from the headway ranges was calculated using the median value of each headway range(0-5, 6-10, 11-15, 16-20) and 25 minutes for the range of > 20 minutes. 13th TRB National Transportation Planning Applications Conference
DART/TRE Initial Wait Time Results by Headway Group 13th TRB National Transportation Planning Applications Conference
DART/TRE Initial Wait Time Results by Headway Group 13th TRB National Transportation Planning Applications Conference
Headway and Initial Wait • Initial wait time does NOT vary meaningfully with variation in headway. • Most transit riders plan their trips in a way that the average initial wait time is around 6 min. with small variance. 13th TRB National Transportation Planning Applications Conference
DART/TRE Transfer Wait Time Results by Headway Group 13th TRB National Transportation Planning Applications Conference
DART/TRE Transfer Wait Time Results by Headway Group 13th TRB National Transportation Planning Applications Conference
Headway and Transfer Wait • Transfer wait time does NOT vary meaningfully with variation in headway but it varies more than Initial wait time • Most transit riders plan their trips as opposed to arriving randomly. The average transfer wait time is around 8 min. with small variance. 13th TRB National Transportation Planning Applications Conference
DART/TREResults by Trip Purpose * Wait Time from the headway ranges was calculated using the median value of each headway range(0-5, 6-10, 11-15, 16-20) and 25 minutes for the range of > 20 minutes. 13th TRB National Transportation Planning Applications Conference
HBW Initial Wait Time Results by Time of Day • Initial wait time for HBW trips in different time of day • periods follows the same pattern • Average initial wait time for HBW trips is 5 minutes 13th TRB National Transportation Planning Applications Conference
HNW Initial Wait Time Results by Time of Day • Initial wait time for HNW trips in different time of day • periods follows the same pattern • Average initial wait time for HNW trips is 7 minutes 13th TRB National Transportation Planning Applications Conference
NHB Initial Wait Time Results by Time of Day • Initial wait time for NHB trips in different time of day • periods follows almost the same pattern • Average initial wait time for NHB trips is 8 minutes 13th TRB National Transportation Planning Applications Conference
HBW Transfer Wait Time Results by Time of Day • Transfer wait time for HBW trips in different time of day • periods follows the same pattern • Average transfer wait time for HBW trips is 8 minutes 13th TRB National Transportation Planning Applications Conference
HNW Transfer Wait Time Results by Time of Day • Transfer wait time for HNW trips in different time of day • periods follows the same pattern • Average transfer wait time for HNW trips is 8 minutes 13th TRB National Transportation Planning Applications Conference
NHB Transfer Wait Time Results by Time of Day • Transfer wait time for NHB trips in different time of day • periods almost follows the same pattern • Average transfer wait time for NHB trips is 8 minutes 13th TRB National Transportation Planning Applications Conference
Wait Time Survey Conclusions • Regardless of the headway, an overwhelming majority of : • Transfer wait times are less than 10 minutes (average 8 minutes); and • Initial wait times are less than 8 minutes (average 6 minutes). • As a result of the survey, it was determined that initial and transfer wait times have little to do with the average headway of the routes in the DFW region 13th TRB National Transportation Planning Applications Conference
References 1. Turnquist, Mark A., “A Model for Investigating The Effects of Service Frequency and Reliability on Bus Passenger Wait Time”, Transportation Research Record, Publication 663, pages 70-73, Transportation Research Board, Washington, D.C., 1978. 2. Fan, Wei, Machemehl, Randy B., “Do Transit Users Just Wait or Wait with Strategies for the Bus? Some Numerical Results You Should See as a Transit Planner”. Submitted for Publication in the 2009 Transportation Research Record and Presentation at the 88th Annual Meeting of the TRB, Washington, D.C., January 2009. (reference obtained directly from the corresponding author) 3. Mishalani, Rabi G., McCord, Mark M., Wirtz, John, “Passenger Wait Time Perceptions at Bus Stops: Empirical Results and Impact on Evaluating Real-Time Bus Arrival Information”, Journal of Public Transportation, Vol. 9, No.2, 2006. 4. Booz Allen Hamilton, “Measurement Valuation of Public Transport Reliability”, Land Transport New Zealand Research Report 339, 2007. 13th TRB National Transportation Planning Applications Conference
Contact Information • Kathy Yu kyu@nctcog.org • Arash Mirzaei amirzaei@nctcog.org • Behruz Paschai bpaschai@nctcog.org 13th TRB National Transportation Planning Applications Conference