Download
1 / 17
170 likes | 399 Vues
New Features on the FONIX FP35 Hearing Aid Analyzer. Version 6.00. Hardware Features. Battery Current Drain External Input (v5). Line In. Software Features. Improved Digital Speech Test for Frequency-Shifting Hearing Aids

E N D
New Features on the FONIX FP35 Hearing Aid Analyzer Version 6.00
Hardware Features • Battery Current Drain • External Input (v5) Line In
Software Features • Improved Digital Speech • Test for Frequency-Shifting Hearing Aids • Modified NAL-NL1 Fitting Rule for low to moderate gain hearing aids • 1/3 Octave Analysis
Improved Digital Speech • Digital Speech signal sometimes interfered with feedback management and other advanced features on some hearing aids • Modifications have been made to improve test results • New feature automatic with DIG SPCH is the selected input source
A little theory… Noise Reduction Old Method Sample from Microphone Averaging to remove noise Frequency Analysis Great for eliminating momentary noise, but a problem when testing new, complex hearing aids with feedback management and other advanced features.
New Noise Reduction with Digital Speech and Spectrum Analysis New Method Sample from Microphone Averaging to remove noise Frequency Analysis Should produce a smoother frequency response without interfering with feedback management software. Also: Smoothing has been added to Digital Speech measurements in Coupler Multicurve.
Comparison of test results using Digital Speech Version 5.01 software Version 6.00 software
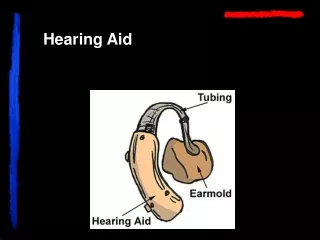
New Test for Freq-Shift Hearing Aids • Graph entire response of hearing aid to a pure-tone signal (default: 4000 Hz) Peak response Input signal Choose DIG FS with F4 in Coupler Multicurve Screen to perform test
Modified NAL-NL1 Targets • Some customers have reported that NAL-NL1 targets are hard to fit with some moderate gain hearing aids • Competing analyzers have version of NAL-NL1 with less gain prescription • We have created a “MOD NAL” target that prescribes 3 dB per octave less gain than standard NAL-NL1 • Both NAL-NL1 and MOD NAL are available in v6.00 software
Comparison of NAL-NL1 and MOD NAL NAL-NL1 standard target MOD NAL reduced target Modified formula affects both Real-ear SPL and Real-ear Insertion Gain targets Note: Audiogram used to create these targets is flat 30 dB HL
100 Hz FFT vs Third Octave Analysis Third Octave analysis 100 Hz FFT analysis
Think of the output of a frequency response as energy. Each point on the response is a “bin.” More bins = better resolution, less output per bin First: Thought Experiment: 100 Hz vs 50 Hz Analysis
All FONIX analyzers perform “100 Hz FFT” analysis Frequency response is divided into 79 different points that are 100 Hz equidistant (200, 300, 400… 7900, 8000 Hz) In Third Octave analysis, frequency response is divided into 17 different points: 200, 250, 315, 400, 500, 630, 800, 1000, 1250, 1600, 2000, 2500, 3150, 4000, 5000, 6300, and 8000 Third Octave analysis has been resolution in the low frequencies and less resolution in the high frequencies due to logarithmic scaling 100 Hz FFT Analysis vs Third Octave Difference between 100 Hz FFT and Third Octave analysis is 3 dB per octave
Important Notes • This 3 dB per octave difference only occurs when viewing results in terms of dB SPL (coupler or real-ear). Gain measurements are not affected. • This difference only occurs when using broadband signals. During a pure-tone sweep, only one “bin” is filled at a time, so the energy is not distributed.
Third Octave analysis on the FP35 analyzer Available in Real-ear SPL and Coupler Multicurve test screens.
Visible Speech Updates Speech signal input RMS Output Diamonds = Peak Pulsed Average Decay Use a connected CD player or iPod for the input signal!