Introduction to Scale Maps and Basic Cartography
Introduction to Scale Maps and Basic Cartography. By: Alix Flavelle. Unit: M09U01. Introduction. This presentation covers: an introduction to scale maps, what they are and how they are made; basic cartography – standard conventions in making maps. . What is a scale map?.

Introduction to Scale Maps and Basic Cartography
E N D
Presentation Transcript
Introduction to Scale Maps and Basic Cartography By: Alix Flavelle Unit: M09U01
Introduction • This presentation covers: • an introduction to scale maps, what they are and how they are made; • basic cartography – standard conventions in making maps.
What is a scale map? • A map drawn using measurement • Shows a distance measured on the ground according to a certain proportion • Measures direction also • Any point on the map has a relationship to any other point according to a measured distance and direction
What is cartography? • Cartography is the art and science of making maps. • There are standard cartographic conventions for making scale maps.
Basic elements of a scale map • Symbols and a legend • Scale • Direction (indicated by the north arrow) • Map grid or coordinate system • About the map (date created, title, author, source information)
Why use symbols on a map? • Words alone would clutter the map. • Symbols can help organise the information. • Symbols can depict complex ideas or things. • The legend or reference explains the symbols.
Types of maps • Base maps show where something is in space. • Thematic maps tell the story about the place.
Base maps • Base maps are reference maps. They contain: • reference features such as rivers, roads, terrain and settlements; • cartographic references such as a coordinate system, north direction and scale.
Types of base maps • Topographic maps • Radar image maps • Aerial photo maps • Satellite image maps • River maps
Thematic maps • Depict a specific theme or subject about a certain geographic area • Illustrate physical, social, political, cultural, economic, sociological, agricultural or any other aspects of a place
Topographic maps • Most common kind of base map • Topography means shape and elevation of the land • Topography is shown with contour lines
Contour lines • Indicate height or elevation of the land above sea level
Contour lines • Pattern of the contour lines show the shape of the land • Note that contour lines: • are never straight; • never cross each other; • always cross rivers.
Contour interval • The vertical distance between two adjacent contour lines • The same for all the contour lines on the map • Depends on the scale of the map
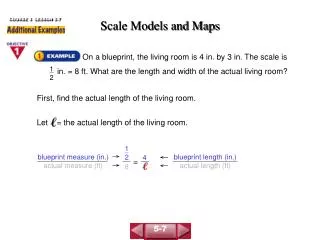
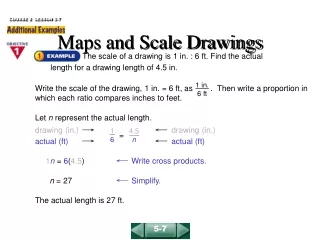
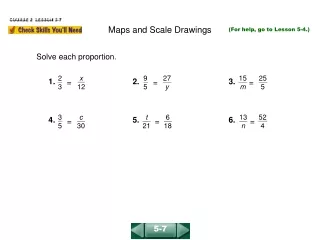
What does scale mean? • Scale is about distance. How long? How far? How wide? How far on the map and how far on the ground? • A map drawn to scale means that the distance between any two points on the drawing is in proportion to the distance on the ground.
How is scale written? • A fraction scale looks like this: 1:25,000. • It is written or said like this: “one to twenty-five thousand scale”. • It is shown as a graph scale like this:
1:25,000 scale • 1 centimetre (cm) on map = 25,000 cm on the ground • 1 cm on the map = 250 metres (m) on the ground • 4 cm on the map = 1 kilometre (km) on the ground
Relative scale • Maps may be small, medium or large scale • Large scale map: smaller area, more detail, more specific • Small scale map: larger area, less detail, more general
Direction on a map • Why draw maps with north at the top? It is a standard convention. • Compasses are made to measure to the magnetic north pole of the Earth.
Where is north? • We are facing north when our left hand points west where the sun sets and our right hand points east where the sun rises. • We use a compass to measure the location of north; the magnetic needle always points to north.
North on the map • Magnetic north is measured by a compass. • Grid north follows the grid lines of the coordinate system the map is made on. • True north corresponds to the Earth’s axis, the North Pole.
Magnetic declination • The difference or angle between magnetic north and true north • The calculation for the difference is shown on a topographic map • Adjust your compass accordingly
Measure direction on a map • Use a protractor or compass to measure the degrees or angle from the north line • Both measure using a circle of 360 degrees
The map grid • Imaginary lines crossing the globe • Meridian lines are drawn north-south • Parallel lines are drawn east-west • Where the lines cross is a coordinate point
Coordinate systems • Two common coordinate systems are: • the geographic coordinate system • the Universal Transverse Mercator (UTM)
Geographic coordinate system • Latitude lines run east-west and are parallel. • Longitude lines run north-south. • Lines are numbered in degrees, minutes and seconds, like reading a clock. • Why degrees? Because angles are always measured in degrees.
Universal Transverse Mercator (UTM) • On a global map, UTM lines are straight. • UTM is a type of projection, calculated to make a flat map of the round Earth. • UTM zones are numbered east to west and lettered north to south. • Each zone is equivalent to 6o. • The measurement unit is metres.
Strengths of scale maps • Can measure distance, direction and area • Made according to conventions so they have validity in the eyes of officials • Objective viewpoint leads to clear discussion between community and “outsiders”
Limitations of scale maps • Community members may not understand the map or the process. • It is difficult to draw the local perception of the land and the subjective importance of things. • Discussions with officials may get diverted to technology and accuracy and away from the real issues.