Introduction to Maps
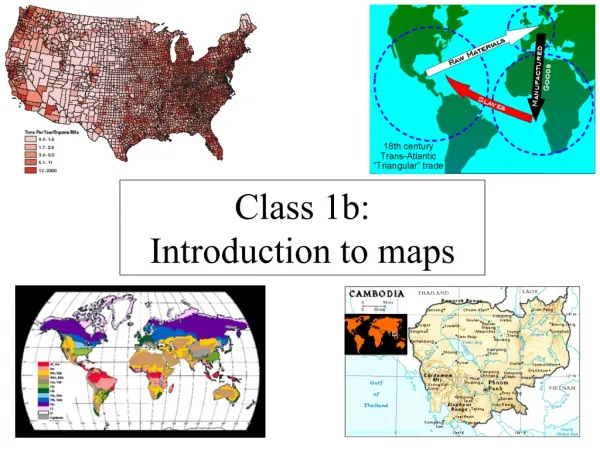
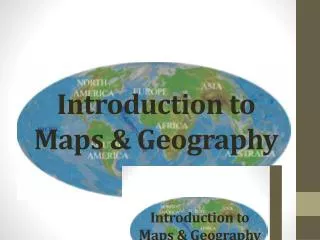
Introduction to Maps. What is a map?. We usually think it has to do with JUST geography Map: n, a diagrammatic representation of an area of land or sea showing physical features, cities, roads, etc. What about population density?. Is this a map?. Electron densities

Introduction to Maps
E N D
Presentation Transcript
What is a map? • We usually think it has to do with JUST geography • Map: n, a diagrammatic representation of an area of land or sea showing physical features, cities, roads, etc.
Is this a map? • Electron densities • Gnome of a plant pathogen • Star evolution
I. Latitude vs Longitude • Any location on earth can be described using the grid system longitude and latitude • Latitude describes the north and south direction while longitude describes east-west direction.
A. Latitude • 1. Also called parallels (describes North and South) • 2. 0˚ (degrees) at the equator and 90˚ at the poles.
B. Longitude • 1. Also called meridians. Farthest apart at the equator and converge at the poles. East and west from the prime meridian. • 2. Prime meridian: starting point for measuring longitude 0˚ located in Greenwich, England • 3. Ranges from 0˚ (prime meridian) to 180˚ (International Dateline)
C. Degrees, Minutes, Seconds • 1. Minutes and seconds are used if you want to be more precise about location. • 2. 1˚= 60 minutes and 1 minute= 60 seconds • Example: Mount St Helens in Washington is 46˚11’55”N and 122˚11’15” W. LATITUDE IS ALWAYS WRITTEN FIRST.
D. How to find a location • 1. Begin at the point where the prime meridian and equator intersect. • 2. Move North (up) or South (down) the indicated number of degrees (latitude). • 3. From that point, while still on the prime meridian, move left (west) or right (east) the correct number of degrees (longitude).
II. Map Projections • A. Mercator Map • 1. Used for navigation because North, South, East, West are in straight lines. • 2. Distorted at large scales especially at the poles. • 3. Has parallel lines of longitude and latitude.
Map Projections Cont. • B. Conic Projections • 1. Equal in distance and direction but distorts shape and area especially near the poles . • 2. Accurate for small areas and are used for weather and road maps.
Map projections cont • C. Gnomonic Projection • 1. Distorts in direction and distance between landmasses. • 2. Useful in planning long distance trips by air or sea because you can travel along “great circles.” • -Great Circles: any two lines of longitude that cut the earth in two equal halves. The only line of latitude that is a great circle is the equator.
Great Circles • Shortest distance between two points.
III. The short of the long • D. There is no such thing as a perfect map (only perfect globe). They are always distorted by: • 1. Area: regions of map should be proportional to those on Earths surface (Mercator: Africa and Greenland distortion) • 2. Distance • 3. Shape • 4. Direction
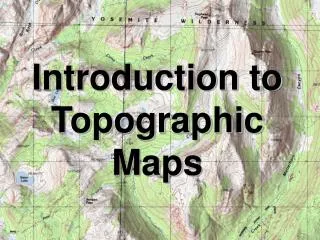
IV. Topographic Maps • A. Contour lines: connect points of equal elevation. • B. Contour interval: difference in elevation between two contour lines • C. Index contour: Darker lines (usually every 5th line)
Topographic Maps Cont • C. Shows changes in elevation. Examples include mountains, rivers, hills, and valleys.
V. Reading Maps • A. Map legend: symbols that represent human-made and natural made features.
Reading Maps cont. • B. Map Scales (3 Types): ratio between distances on a map and actual distances on Earth • 1. Verbal: Expresses distance as a statement Example: “One centimeter equals one kilometer” • 2. Graphic scale: bar graph • 3. Fractional scale: fraction or ratio
Calculating scale • You have a scale drawing of a boat. The length of the boat on the drawing is 3 cm. What is the actual length of the boat? • Use cross multiplying.
Two important points about scale • If you were to increase or decrease the size of a map which map scale would be accurate? Which ones wouldn’t? • Large scales have a large fraction (1:10,000), small scales have a small fraction (1:1,000,000). However, large scale maps show a small area of earth in great detail; while small scale maps show large areas in great detail.