Introduction to Maps
Introduction to Maps. What is a Map?. A map can be simply defined as an abstraction of the real world that is used to depict, analyze, store, and communicate spatially organized information about physical and cultural phenomena.

Introduction to Maps
E N D
Presentation Transcript
What is a Map? • A map can be simply defined as an abstraction of the real world that is used to depict, analyze, store, and communicate spatially organized information about physical and cultural phenomena. • Maps are used to display both cultural and physical features of the environment.
What is a Map? • Standard topographic maps show a variety of information including roads, land-useclassification, elevation, rivers and other water bodies, political boundaries, and the identification of houses and other types of buildings.
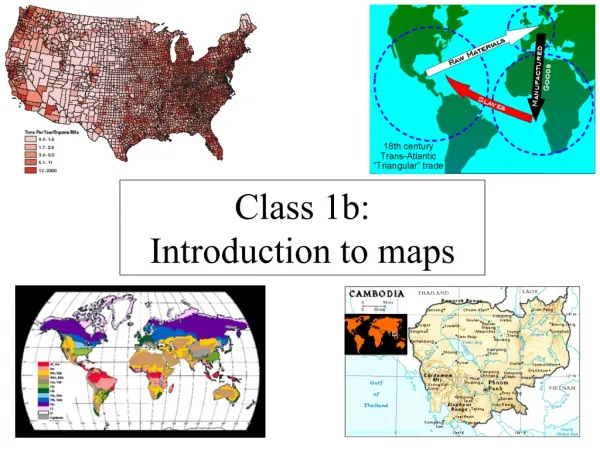
What is a Map? • The art of map construction is called cartography. • Cartographers classify maps into two broad categories: reference maps and thematic maps.
What is a Map? • Reference maps normally show natural and human-made objects from the geographical environment with an emphasis on location. (e.g. atlases and topographic maps) • Thematic maps are used to display the geographical distribution of one phenomenon or the spatial associations that occur between a number of phenomena.
Elements of a Map Seven Elements of a Map • Title • Border • Legend or key • Scale • Directions • Location of area • Symbols
Reference Map: Political Map • A political map does not show any topographic features. • It instead focuses solely on the state and national boundaries of a place. • They also include the locations of cities both large and small, depending on the detail of the map.
Reference Map: Physical Map • A physical map is one that shows the physical landscape features of a place. • They generally show things like mountains, rivers and lakes and water is always shown with blue. • Mountains and elevation changes are usually shown with different colors and shades to show relief.
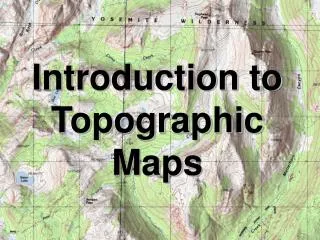
Reference Map: Topographic Map • A topographic map is similar to a physical map in that it shows different physical landscape features. • They are different however because they use contour lines instead of colours to show changes in the landscape. • Contour lines on topographic maps are normally spaced at regular intervals to show elevation changes
Reference Map: Climate Map • A climate map shows information about the climate of an area. • They can show things like the specific climatic zones of an area based on the temperature, the amount of snow an area receives or average number of cloudy days.
Reference Map: Economic/Resource Map • An economic or resource map shows the specific type of economic activity or natural resources present in an area through the use of different symbols or colours depending on what is being shown on the map.
Reference Map: Road Map • A road map is one of the most widely used map types. • These maps show major and minor highways and roads (depending on detail) as well as things like airports, city locations and points of interest like parks, campgrounds and monuments.
Thematic Map • A thematic map is a map that focuses on a particular theme or special topic.
The Problem with Map Projection Note: The shape of the Earth's surface can be described as an ellipsoid (a three-dimensional shape that departs slightly from a purely spherical form). Map projection is a cartographic process that is used to represent the Earth's 3D surface onto a 2D map. This process creates some type of distortion artifact on the map.
The Problem with Map Projection • Geographic properties affected by projection distortion include: distance; area; straight line direction between points on the Earth; and the bearing of cardinal points from locations on our planet. Earth as observed from a vantage point in space.
The Problem with Map Projection • On a Mercator projection, distortion increases at an increasing rate as one moves toward higher latitudes. • Area distortion makes continents in the middle and high latitudes seem larger than they should be. Specifically designed for nautical navigation.
The Problem with Map Projection • The Gall-Peters projection corrects the distortion of area common in Mercator maps. • It removes the bias in Mercator maps that draws low latitude countries as being smaller than nations in middle and high latitudes.
The Problem with Map Projection The Gall-Peters projection has been officially adopted by a number of United Nations organizations.
The Problem with Map Projection • The Miller Cylindrical projection is anothercommon two-dimensional map used to represent the entire Earth in a rectangular area. • In this project, the Earth is mathematically projected onto a cylinder tangent at the equator. This projection in then unrolled to produce a flat two-dimensional representation of the Earth's surface. • This projection reduces some of the scale exaggeration present in the Mercator map.
The Problem with Map Projection The Miller Cylindrical projection describes shapes and areas with considerable distortion and directions are true only along the equator.
The Problem with Map Projection • The Robinson projection shows the entire Earth with less distortion of area. However, this feature requires a tradeoff in terms of inaccurate map direction and distance.
The Problem with Map Projection • The Mollweide projection improves on the Robinson projection and has less area distortion From the equator to 40° 40' North and South the east-west scale is illustrated too small. From the poles to 40° 40' North and South the east-west scale is illustrated too large.
The Problem with Map Projection • The final projection presents areas on a map that are proportional to the same areas on the actual surface of the Earth .However, this Sinusoidal Equal-Area projection suffers from distance, shape, and direction distortions.
MapScale • Ratio between the distance between two points found on a map compared to the actual distance between these points in the real world • On most maps, the map scale is represented by a simple fraction or ratio. This type of description of a map's scale is called a representative fraction.
MapScale • The ratio form is most commonly found on maps (1:1,000,000). • Scale can also be described on a map by a verbal statement (1 cm on the map equals 10 km on the Earth's surface or 1 in represents approximately 16 mi)
MapScale • Most maps also use graphic scale to describe the distance relationships between the map and the real world. In a graphic scale, an illustration is used to depict distances on the map in common units of measurement. • Graphic scales are quite useful because they can be used to measure distances on a map quickly.
MapScale • Maps are often described, in a relative sense, as being either small scale or large scale.
Location on Maps • Most maps allow us to specify the location of points on the Earth's surface using a coordinate system. • For a 2D map, this coordinate system can use simple geometric relationships between the perpendicular axes on a grid system to define spatial location. A grid coordinate system defines the location of points from the distance traveled along two perpendicular axes from some stated origin.
Location on Maps • The geographical coordinate systemmeasures location from only two values, despite the fact that the locations are described for a three-dimensional surface.
Location on Maps • Values which are used to define location are both measured relative to the polar axis of the Earth. The two measures used in the geographic coordinate system are called latitude and longitude.
Location on Maps • Measurement of latitude and longitude relative to the equator and the Prime Meridian and the Earth's rotational or polar axis.
Location on Maps • Another commonly used method to describe location on the Earth is the Universal Transverse Mercator (UTM) grid system. • This rectangularcoordinate system is metric, incorporating the meter as its basic unit of measurement. UTM also uses the Transverse Mercator projection system to model the Earth's spherical surface onto a two-dimensional plane. • The UTM system divides the world's surface into 60 - six degree longitude wide zones that run north-south. These zones start at the International Date Line and are successively numbered in an eastward direction.
Location on Maps • The UTM system has been modified to make measurements less confusing. In this modification, the six degree wide zones are divided into smaller pieces or quadrilaterals that are eight degrees of latitude tall. • Each of these rows is labeled, starting at 80° South, with the letters C to X consecutively with I and O being omitted.
Location on Maps • The last row X differs from the other rows and extends from 72 to 84° North latitude (twelve degrees tall). • Each of the quadrilaterals or grid zones are identified by their number/letter designation. In total, 1200 quadrilaterals are defined in the UTM system. • The quadrilateral system allows us to further define location using the UTM system.
Location on Maps For the location 50° North and 9° West, the UTM coordinate can now be expressed as Grid Zone 29V, 500,000 meters E, 5,538,630 meters N.
Distance on Maps • Depicting the Earth's three-dimensional surface on a two-dimensional map creates a number of distortions that involve distance, area, and direction. • It is possible to create maps that are somewhat equidistance. However, even these types of maps have some form of distance distortion.
Direction on Maps • In the field, the direction of features is often determined by a magnetic compass which measures angles relative to Magnetic North. • Compass directions can be described by using either the azimuth system or the bearing system.
Direction on Maps • The azimuth system calculates direction in degrees of a full circle. A full circle has 360 degrees. • North has a direction of either the 0 or 360°.
Direction on Maps • The bearing system divides direction into four quadrants of 90 degrees. • North and south are given the measurement 0 degrees. • East and west have a value of 90 degrees. The first measurement (green) is found in the north - east quadrant. As a result, its measurement is north 75 degrees to the east or N75°E.
Direction on Maps • Global Positioning Systems (GPS) can calculate one's location to an accuracy of about 30-meters. • These systems consist of two parts: a GPS receiver and a network of many satellites. • Radio transmissions from the satellites are broadcasted continually. The GPS receiver picks up these broadcasts and through triangulation calculates the altitude and spatial position of the receiving unit. • A minimum of three satellite is required for triangulation.
Direction on Maps • GPS receivers determine latitude, longitude, and elevation anywhere on or above the Earth's surface from signals transmitted by a number of satellites. • These units can also be used to determine direction, distance traveled, and determine routes of travel in field situations.