Download
1 / 25
260 likes | 367 Vues
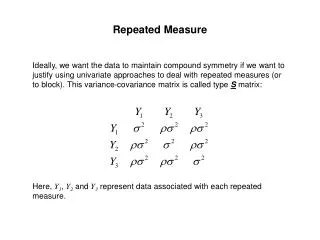
Understand, calculate, and analyze the results of repeated measurements experiments in agriculture. Learn the significance of measuring trends over time for various parameters like body weight, egg production, and feed efficiency. Explore different layouts and statistical analyses, such as ANOVA and orthogonal transformations.

E N D
Repeated MeasurementExperiments By Dr.Wuttigrai Boonkum Department of Animal Science, Faculty of Agriculture, KKU
Introduction Input Input Observation 1st MY,2nd MY… BW,WW,YW Input Input Observation ADG,NBA,BF,LEA 1st week ADG,2nd week ADG… Observation Input Input 1st MM eggprod.,2nd MM egg… EggProd.,FCR,FI Repeat measurements Single measurement
Objective • นศ. สามารถอธิบายความหมายและประโยชน์ของงานทดลองที่มีการวัดซ้ำได้ • นศ.สามารถอธิบายขั้นตอนการคำนวณของงานทดลองที่มีการวัดซ้ำได้ • นศ.สามารถวิเคราะห์ อ่านผล และสรุปผลของงานทดลองที่มีการวัดซ้ำได้
Repeated Measurements คืออะไร ?
Repeated measurements • ไม่ใช่แผนการทดลอง เป็นเพียงวิธีการจัดเก็บข้อมูลเพื่อใช้วิเคราะห์รูปแบบหนึ่ง (เก็บข้อมูลต่อเนื่องติดต่อกัน) • ข้อมูลที่เก็บได้มาจากหน่วยทดลองเดิม โดยแตกต่างกันที่เวลาที่เก็บข้อมูล • ใช้ในกรณีที่ผู้ทดลองต้องการทราบแนวโน้มของค่าสังเกตที่มีต่อทรีทเมนต์เมื่อเวลาเปลี่ยนไป • มีรูปแบบทั่วไปคล้ายกับ แผนการทดลองแบบ split-plot in time ทั้ง statistical model, ANOVA
The kind of repeated measurement • Repeated measurements in CRD • Repeated measurements in RCBD • Repeated measurements in LSD • Double Repeated measurements
Layout Repeated measurements in CRD T1R3 T1R3 T1R3 T1R3 T1R3 T1R1 T1R1 T1R1 T1R1 T1R1 T1R2 T1R2 T1R2 T1R2 T1R2 T2R3 T2R3 T2R3 T2R3 T2R3 T2R1 T2R1 T2R1 T2R1 T2R1 T2R2 T2R2 T2R2 T2R2 T2R2 T3R3 T3R3 T3R3 T3R3 T3R3 T3R1 T3R1 T3R1 T3R1 T3R1 T3R2 T3R2 T3R2 T3R2 T3R2
Layout Repeated measurements in RCBD T1 T2 T3 T1 T2 T3 T1 T2 T3
Layout Repeated measurements in LSD T1A1 T2A2 Period1 T3A3 T1A2 T2A3 Period2 T3A1 T1A3 T2A1 Period3 T3A2
Layout Double Repeated measurements Week 1 T1 T2 T3 T1 T2 T3 T1 T2 T3
Layout Double Repeated measurements Week 2 T1 T2 T3 T1 T2 T3 T1 T2 T3
ANOVA Repeated measurements in CRD Repeated measurements in RCBD
ANOVA Repeated measurements in LSD
ANOVA Double Repeated measurements
Step by Step of analysis Repeated measurements Mauchly Repeated data P-value > Chi Autocorrelation or correlated error test (spherecity) Orthogonal Transformation** *,** ns Split-plot in time (ns) Multivariate (Interaction Time*Trt) Wilk’s lambda** Pillai’s trace Hotelling-Lowley trace Roy’s greatest roots Split-plot in time (sig) P-value Univariate (Interaction Time*Trt) Greenhouse-Geisser G-G** Huynh-Feldt H-F Epsilon 01 Adjust P-value
Check auto correlation Upper number = correlation, lower number = p - value
Check multivariate ** ** ปัจจัยเนื่องจากเวลามีผลต่อค่าสังเกต P < 0.05 (0.0387) Back
ทรีทเมนต์มีผลต่อค่าสังเกต (0.0124) Back ** ทดสอบ univariate ดูจากค่า epsilon ใกล้ 1 หรือ Spherecity ไม่พบความแตกต่างทางสถิติ ให้ใช้ค่า p-value ธรรมดา
linear Back Mean = Time(linear); Trt = Time*Trt(linear)
ค่าสังเกตมีแนวโน้มลดลงเมื่อเวลาเปลี่ยนไปค่าสังเกตมีแนวโน้มลดลงเมื่อเวลาเปลี่ยนไป Back