Download
1 / 35
370 likes | 657 Vues
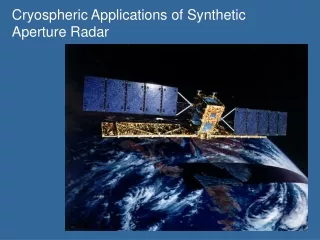
ADVANCED RADAR APPLICATIONS IN METEOROLGY. Nurgül Ertem 110000531. Radar in Meteorology. Radar stands for R adio D etection and R anging. It refers to the use of radio waves to detect objects and determine the distance (range) to the object .

E N D
ADVANCED RADAR APPLICATIONS IN METEOROLGY Nurgül Ertem 110000531
Radar in Meteorology Radar stands for Radio Detection and Ranging. It refers to the use of radio waves to detect objects and determine the distance (range) to the object. Radars, however, will be our focus here. They have particularly become important in meteorology because of the following reasons. • (i) They can see through fog, cloud, rain and other types of atmospheric conditions which light cannot pass through. • (ii) They can observe many places in the sky almost simultaneously. • (iii) They can run continuously, often without operators being present (computer controlled). • (iv) They can operate during both day and night. • (v) The data from them can be easily stored to computer and then subjected to many types of sophisticated analysis. • (vi) Modern solid-state radars often need little maintenance, or replacement of parts, so the largest expense is often the setup costs. • (vii) Radars are not restricted to ground-level studies, and can often observe several kilometres upward into the atmosphere
Signal Processing and Product Generation • The processing of radar data generally involve two distinct steps. The first step, called signal processing, is the extraction of raw radar parameters like echo strength (reflectivity) or Doppler velocity from the radar signals coming out of the receiver. The second step, called data processing or product generation, is the further processing of raw radar parameters in order to obtain information that is useful for meteorological or hydrological purposes. In general, these two steps are done by different computers, signal processing being done at the radar site, while product generation can be done everywhere the data are sent to.
Simple Radar System antenna transmitter 106 W display T/R switch receiver 10-14W
Radar System Transmitter--produces high power pulses at desired frequency. Pulses may be 1 microsecond in duration. Receiver--detects, amplifies and converts (digitizes) received voltages from each pulse as a function of range Antenna--radiates transmitted power in narrow beam for maximum “gain” --receives backscattered signal from targets T/R switch--switches antenna between transmitter and receiver at high rate, typically once every millisecond Receivers are designed to detect very weak signals, on the order of 10-13 to 10-14 watts. Transmitted power is typically 106 watts, peak power.
Radar Systems More advanced radars provide either frequency agility or polarization agility. Frequency agility--transmit and receive multiple frequencies (near in frequency to each other) to increase sampling rate Polarization agility--alternatively transmit either horizontal or vertical polarization to provide wealth of information on particle phase, shape and orientation
Sending and Receiving Signals • detecting a target • The radar creates an electromagnetic energy pulse which is focused by an antenna and transmitted through the atmosphere. Objects in the path of this electromagnetic pulse, called targets, scatter the electromagnetic energy. Some of that energy is scattered back toward the radar. • The receiving antenna (which is normally also the transmitting antenna) gathers this back-scattered radiation and feeds it to a device called a receiver.
RADAR • Radar weather information are used to determine current atmospheric conditions, but meteorologists must integrate data from many sources to get a complete and accurate picture of atmospheric conditions. Meteorologists feed current data into computer models to help them predict weather conditions (forecast) and make critical decisions • Radar could be used to answer the following questions about the line of precipitation. What is the intensity of the precipitation (in this case snow)? What direction and at what speed are the snow bands moving? Will the snow bands become stronger or weaker?
COLORED RADAR • The location of the colored radar echoes indicate where precipitation is falling and the various colors indicate the intensity of the precipitation through the color code in the lower left corner of the image. • The example radar image above shows several strong thunderstorms moving through Illinois and Indiana on April 20, 1996. Regions of light and dark blue indicate regions of lighter precipitation while areas of red and pink indicate strong, to occasionally severe thunderstorms. Normally, it is difficult to distinguish precipitation type on the basis of the radar reflectivity alone. Snow and light drizzle both produce radar reflectivity with about the same value. Melting snow and moderate rain also have similar values. Very high reflectivities (the grays on the scale on the image above) are always associated with hail.
Radar in meteorology Weather radars play a vital role in short term weather forecasting and for meteorological research. They are being used routinely in meteorology to monitor storms and follow their evolution, as well as observe winds and detect regions where severe weather might develop. Specialists in radar meteorology, with backgrounds in meteorology, engineering, and computer science, work to improve the use of radar as a meteorological instrument. For example, our large S-band Doppler radar is used for weather surveillance around the Montreal area. Part of the Canadian radar network, it is used by the local weather office to monitor weather in real-time. Its data are used in a variety of applications, from severe weather detection to sewer flow forecasting.
How Does Radar Work? Return back single antenna target send short pulses of energy The antenna rotates about a vertical axis, scanning the horizon in all directions
Radar - How Radar Works • Radar works by transmitting a pulse of electromagnetic energy. • Objects (raindrops, ice, snow, birds, insects, terrain, and buildings) reflect that energy. Part of the reflected energy is received back at the radar. Once the radar receives the reflected signal, computer programs and meteorologists interpret the signal to determine where it is precipitating.
Radar Observatory • Marshall Radar Observatory itself where the main radar facility is located. It consists of a dual-wavelength, dual-polarization, Doppler scanning radar system. With its 9 m antenna sitting on top of a tower, it is one of the most sophisticated weather radar in the world. The first element of the system is a dual-polarization, Doppler, long wavelength (S-band) radar which measures the intensity, the velocity, and the shape of weather targets (rain, snow, hail, etc.) up to a range of 250 km. It is complemented by a shorter wavelength (X-band) radar and two additional receivers located elsewhere which help us obtain a more complete picture of the weather. This radar is used 24 hours a day to monitor the storms around Montreal. After the radar signals have been processed and interpreted, the data are sent to the weather office and the downtown campus where they are made available on the web in real-time. • Two other radars are located in Ste-Anne de Bellevue. One is a small dual-polarization radar called X-Polito, while the other is a vertically pointing radar (VPR). X-Polito is a prototype low-cost radar developed to measure rainfall over short distances. The VPR is a research radar used primarily to study the formation of precipitation.
Interpreting Doppler Radar Velocities To understand Doppler radial velocity patterns, one first has to consider the geometry of a radar scan. Normally the radar beam is pointed at an elevation angle greater than zero so that the beam, as it moves away from the radar, moves higher and higher above the surface of the earth. Because of this geometry, radar returns originating from targets near the radar represent the low-level wind field, while returns from distant targets represent the wind field at higher levels.
Interpreting Doppler Radar Velocitiesspeed shear wind patterns • On a radar PPI display, the distance away from the radar at the center of the display represents both a change in horizontal distance and a change in vertical distance. To determine the wind field at a particular elevation above the radar, one must examine the radial velocities on a ring at a fixed distance from the radar. The exact elevation represented by a particular ring depends upon the elevation angle of the radar beam.
DOPPLER • Doppler velocity patterns (right) correspond to vertical wind profiles (left), where the wind barbs indicate wind speed and direction from the ground up to 24,000 feet. Negative Doppler velocities (blue-green) are toward the radar and positive (yellow-red) are away. The radar location is at the center of the display • For this first example, wind direction is constant with height, but wind speed increases from 20 knots at the ground to 40 knots at 24,000 feet. Note on the radial velocity field that the maximum inbound velocity is to the west and maximum outbound to the east while to the north and south the radar measures zero radial velocity. This is because the winds are perpendicular to the radar beam when viewed to the north or south.
dual-polarization • In general, weather radars send and receive microwaves at one polarization, usually horizontal. By transmitting and/or receiving radar waves at more than one polarization, additional information can be obtained on the nature of the targets • The most common dual-polarization scheme is the transmission and reception of horizontally and vertically polarized waves.
WSR-88D Radar Imagerydetecting precipitation • The word radar is an acronym from "Radio Detection and Ranging". Radar images are useful for locating precipitation. As a Magnetic Resonance Imaging (MRI) scan examines the inside of a human body, a radar examines the inside of a cloud. A radar sends a pulse of energy into the atmosphere and if any precipitation is intercepted by the energy, part of the energy is scattered back to the radar. These returned signals, called "radar echoes", are assembled to produce radar images.
Radar Instrumentation King City C-band doppler scanning radar Portable C-Band Doppler Scanning Radar Portable X-Band Doppler Scanning Radar Portable 915 MHz Wind Profiler
Radar Instrumentation • Portable/airborne Ka-Band 35 GHz Cloud Radar • Joss-Waldvogel Disdrometer
RADAR IMAGES The radar only makes measurements if sufficient scattering targets (eg: rain, snow, etc) are present, although the tops of mountains are also frequently picked up (they can often be recognized by their zero velocity on the radial velocity image) REFLECTIVITY / REFLECTIVITE
Reflectivity CAPPI • The reflectivity CAPPI (Constant Altitude Plan Position Indicator - radar lingo for a horizontal section at constant altitude - ) is the most often used product for displaying precipitation intensity around the McGill radar. It shows the intensity of all the echoes received by the radar, those we want (like precipitation) as well those we don't (like ground targets) • align="justify"In this case, a large area of precipitation is approaching from the North West. It is made of light stratiform precipitation (in green) with several embedded showers and thundershowers (in warmer colors). Some of these thundershowers actually spawned tornadoes
Surface refractivity • In this example, the refractivity field measured by radar (bottom) is contrasted with simultaneous weather observations over a range of 45 km. Two air masses can be identified, a drier one to the north (10°C dew point temperature) and a wetter one to the south (14°C dew point temperature). The refractivity computed using surface observations (shown in brackets in the upper window) match well the refractivity measured by radar. While the presence of a gradient in moisture could have been inferred from surface observations alone, the radar measured refractivity allow the precise determination of the position of the boundary between the two air masses (shown with heavy dashes).
McGill S-band radar • This radar is used for weather surveillance, providing data in real-time to various users including the local weather office, as well as for meteorological research and the development of automated algorithms of weather detection and identification.
Radar Images • PPI, antenin belirli bir yükseklik açısında (vertical elevation) sabit tutulmasıyla elde edilen bir üründür. Yatayda (azimut) 0-360° tarama yaparak elektromanyetik dalga gönderilir. Bu görüntüde, radarın tespit ettiği ekoların reflektivite değerlerine göre radarın kaplama alanı içerisinde yer alan hedeflerin gerçek koordinatları ve varsa yağışlı bölgeler belirlenir. Görüntünün sağında bulunan renk skalası dBZ cinsinden reflektivite değerlerini gösterir
Some natural disasters (meteorologically) such as avalanche, flood, tornado have occured in many regions of the world and they have caused to the death of huming beings and bringing greate ecenomic losses. Therefore, radars have a great importance in determining of the natural disasters and its early warning systems. CONCLUSION