Download

1 / 16
160 likes | 365 Vues
Phase diagram of solid oxygen at low temperature and high pressure. Reference F. Gorelli, M. Santoro, L. Ulivi, M. Hanfland, Phys. Rev. B 65, 172106 (2002). SHIMIZU Group MIZOBATA Shigeki. Contents.

E N D
Phase diagram of solid oxygen at low temperature and high pressure ReferenceF. Gorelli, M. Santoro, L. Ulivi, M. Hanfland, Phys. Rev. B 65, 172106 (2002) SHIMIZUGroup MIZOBATAShigeki
Contents • Introduction・ Character of oxygen・ Many phases of solid oxygen・ Phase diagram by Raman scattering • Experimental results and discussion • Summary
oxygen magneticelementary molecule important role molecular arrangement in crystal, compressibility of crystal solid oxygen liquid oxygen boiling point・・・90 K light blue and paramagnetic liquid freezing point・・・54 Ksuperconductivity(at 120GPa Tc=0.6 K) http://www.webelements.com/ Oxygen
Solid oxygen • at ambient pressure 23.5 90 K 43.5 54 T(K) cubic rhombohedral monoclinic γ β α liquid short-range AFM order antiferromagnetism (AFM) paramagnetism • at room temperature 5.5 GPa 9.5 10 96 P(GPa) orthorhombic monoclinic rhombohedral monoclinic ε ζ β δ molecular insulator molecular metal
? P-T phase diagram by Raman scattering α: monoclinic δ: orthorhombicexistence of newphases (α´ and δ´) ? S. Desgreniers, Y.K. Vohra, and A.L. Ruoff, J. Phys. Chem. 94, 1117 (1990) • At low temperature and high pressurethephase boundaries are uncertain.
Problems • At low temperature and high pressurethephase boundaries are uncertain. clarify the phase transitions by x-ray diffraction experiment extreme condition (at low temperatureand highpressure) Oxygen is low-Zelement and gas. technical difficulty
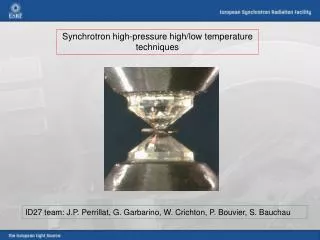
sample ruby gasket Experiment 1 • sample loading for oxygen cool sample loading gas liquid • gas-loading cell (membrane cell) http://www.diacellproducts.com/index.html The gas-loading cell is used to enable the increase of pressure at low temperature.
Temperature (K) δ ? α Pressure (GPa) Experimental process 1 isothermal compression or decompression・・・・ at 19, 180, 240, 277, 300 K
X-ray diffraction pattern • From diffraction pattern at 19 K ・・・・ • 0.96-7.2 GPa: diffraction patterns for the α phase • 7.6 GPa: two phases (α phase and ε phase) coexist • 8.1 GPa: diffraction pattern for ε phase Y. Akahama, Phy. Rev. B, 64, 054105 (2001)
・・・α phase ・・・β phase ・・・ε phase ・・・δ phase Result 1 • No other phases(α´ and δ´ phases) are detected. • The α phase directly transforms to the ε phase. α-δ boundary E. Uemura et al, J. Phys. Condens. Matter 14, 10423 (2002)
Experimental process 2 to produce a fine-grained polycrystalline powder・・・・ very rapid pressure increase up to about 40–50 GPa Temperature (K) decrease pressure until the ε-δ phase transition δ ? from δ phase・・・・ decreasing slowly temperature and pressure α Pressure (GPa)
c 90° b a β´ β´ c monoclinic (α phase) orthorhombic (δ phase) shift of the ab plane (angle β´turns exactly to 90°) b a Structure of α- and δ-oxygen δ- o2 orthorhombic (Fmmm) α- o2 monoclinic (C2/m)
β´≠90°・・・monoclinic (α) β´=90°・・・orthorhombic (δ) The α-δ phase transition and the anisotropy of compressibility are observed. line ・・・ R.D Etters et al., Phys. Rev. B 32, 4097 (1985) Y. Akahama et al., Phys. Rev. B 64, 054105 (2001) The α-δ phase transition δ
○ ・・・・α phase ● ・・・・δ phase ・・・・α-δ transition Result 2 • No other phases(α´ and δ´ phase) are detected. • The δ phase is stable at wide pressure.
δ Result 1 65 K Result 2 α Hysteresis Liquid 300 β Temperature(K) 200 ε 100 0 12 4 10 8 6 Pressure(GPa) • The α phase transforms again to the δ phase increasing the temperature up to 270K.
Summary • No other phases(α´ and δ´ phase) are detected. • By tow X-ray diffraction studies, position of phase-transition boundaries are determined,respectively. • The hysteresis is observed at low temperature and high pressure.