Applying Support Vector Machines to Imbalanced Datasets
240 likes | 262 Vues
Applying Support Vector Machines to Imbalanced Datasets. Authors: Rehan Akbani, Stephen Kwek (University of Texas at San Antonio, USA) Nathalie Japkowicz (University of Ottawa, Canada) Published: European Conference on Machine Learning (ECML), 2004 Presenter: Rehan Akbani

Applying Support Vector Machines to Imbalanced Datasets
E N D
Presentation Transcript
Applying Support Vector Machines to Imbalanced Datasets Authors: Rehan Akbani, Stephen Kwek (University of Texas at San Antonio, USA) Nathalie Japkowicz (University of Ottawa, Canada) Published: European Conference on Machine Learning (ECML), 2004 Presenter: Rehan Akbani Home Page: http://www.cs.utsa.edu/~rakbani/
Presentation Outline • Motivation and Problem Definition • Key Issues • Support Vector Machines Background • Problem in Detail • Traditional Approaches to Solve the Problem • Our Approach • Results and Conclusions • Future Work and Suggested Improvements
Motivation • Imbalanced datasets are datasets where the negative instances far outnumber the positive instances (or vice versa). • Naturally occurring imbalanced datasets: • Gene profiling • Medical diagnosis • Credit card fraud detection • Ratios of negative to positive instances of 100 to 1 are not uncommon.
Key Issues • Traditional algorithms such as SVM, decision trees, neural networks etc. perform poorly with imbalanced data. • Accuracy is not a good metric to measure performance. • Need to improve traditional algorithms so that they can handle imbalanced data. • Need to define other metrics to measure performance.
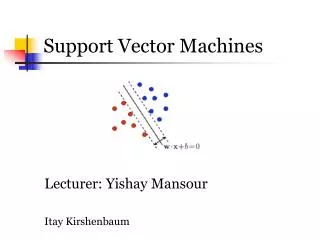
Support Vector Machines Background Find the maximum margin boundary that separates the green and red instances.
Support Vector MachinesSupport Vectors Circled instances are support vectors.
Support Vector Machines Kernels Kernels allow non-linear separation of instances. E.g. Gaussian Kernel
Effects of Imbalance on SVM • Positive (minority) instances lie further away from the “ideal” boundary.
Effects of Imbalance on SVM • Support vector ratio is imbalanced. Support vectors are shown in red.
Effects of Imbalance on SVM • Weakness of Soft-Margins. Minimize the primal Lagrangian: Compromise between minimization of total error and maximization of margin.
Effects of Imbalance on SVM Margin is maximized at the cost of small total error
Traditional Approaches • Oversample the minority class or undersample the majority class. • Sample distribution is no longer random – its distribution no longer approximates the target distribution. • Defense: Sample biased to begin with • With undersampling, we are discarding instances that may contain valuable information.
Problem with Undersampling Before After After undersampling, the learned plane estimates the distance of the ideal plane better but the orientation of the learned plane is no longer as accurate.
Our Approach – SMOTE with Different Costs (SDC) • Do not undersample the majority class in order to retain all the information. • Use Synthetic Minority Oversampling TEchnique (SMOTE) (Chawla et al, 2002). • Use Different Error Costs (DEC) to push the boundary away from positive instances (Veropoulos et al, 1999).
Effect of DEC Before DEC After DEC
Effect of SMOTE and DEC – (SDC) After DEC alone After SMOTE and DEC
Experiments • Used 10 different UCI datasets. • Compared with four other algorithms: • Regular SVM • Undersampling (US) • Different Error Costs (DEC) alone • SMOTE alone • Used linear, polynomial (degree 2) and Radial Basis Function (RBF) (γ = 1) kernels.
Metric Used – g-means • Used g-means metric (Kubat et al, 1997). Higher g-means means better performance: • Sensitivity = TP / (TP + FN) • Specificity = TN / (TN + FP) • Used by researchers such as Kubat, Matwin, Holte, Wu, Chang (1997 – 2003) for imbalanced datasets. • Can be computed easily and results can be displayed compactly. Suitable for use with several datasets and SVM, where time and space are limited.
Results g-means metric for each algorithm and dataset
Results g-means graphs for each algorithm and dataset
Conclusions • Our algorithm (SDC) outperforms all the other four algorithms. Undersampling is the runner-up. • SDC performs better than undersampling in 9 out of 10 datasets. • It always performs better than or equal to SMOTE. • It performs better than or equal to DEC in 7 out of 10 datasets. • It has similar limitations to that of SMOTE: • Assumes the space between two positive neighboring instances is positive. • Assumes the neighborhood of a positive instance is positive.
Future Work and Suggested Improvements • Design a better over sampling technique that does not assume a convex positive space. • Evaluate the algorithm on biological datasets with extremely high degrees of imbalance (over 10,000 to 1). • Find out if the technique can be extended to other ML algorithms which have lower execution time than SVM. • Analyze the robustness of the algorithm against noisy minority instances.
Questions? Questions? Questions? Questions? Questions? Questions?