Overview of Dunk Probe Test Setup for Aluminum and Niobium Samples
80 likes | 194 Vues
This document details the schematic setup of the Dunk Probe test, demonstrating the testing of an aluminum sample (DSAT3) and a niobium sample (ESNT4). It highlights the specifications of the samples, including thickness and dimensions, and the methods of creating electrical connections. The experiment involved submerging the samples in liquid helium for thermal equilibrium while measuring voltage and resistance. Challenges such as noise from measurements and thermal effects are discussed, along with observed trends in resistance versus current.

Overview of Dunk Probe Test Setup for Aluminum and Niobium Samples
E N D
Presentation Transcript
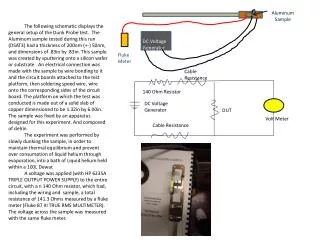
The following schematic displays the general setup of the Dunk Probe test. The Aluminum sample tested during this run (DSAT3) had a thickness of 200nm (+-) 50nm, and dimensions of .83in by .83in. This sample was created by sputtering onto a silicon wafer or substrate . An electrical connection was made with the sample by wire bonding to it and the circuit boards attached to the test platform, then soldering speed wire, wire onto the corresponding sides of the circuit board. The platform on which the test was conducted is made out of a solid slab of copper dimensioned to be 1.32in by 6.00in. The sample was fixed by an apparatus designed for this experiment. And composed of delrin The experiment was performed by slowly dunking the sample, in order to maintain thermal equilibrium and prevent over consumption of liquid helium through evaporation, into a bath of Liquid helium held within a 100L Dewar. A voltage was applied (with HP 6235A TRIPLE OUTPUT POWER SUPPLY) to the entire circuit, with a n 140 Ohm resistor, which had, including the wiring and sample, a total resistance of 141.3 Ohms measured by a fluke meter (Fluke 87 III TRUE RMS MULTIMETER). The voltage across the sample was measured with the same fluke meter. Aluminum Sample DC Voltage Generator Fluke Meter Cable Resistance 140 Ohm Resistor DC Voltage Generator DUT Volt Meter Cable Resistance
The following schematic portrays the set up of the IR Dewar Test. In this run two samples where tested, an aluminum (DSAT7) sample 70 nm thick, dimensions of .83 by .83 inches, and deposited in Gartek; and a niobium (ESNT4) sample 1 micron thick , dimensions of .83 by .83, and deposited at 10 E(-7) torr and CPA. The samples where tested on a copper test platform designed to fit into the IR Dewar, and where positioned with grease. An electrical connection was made to the samples through wirebonds. In the DC current run the same equipment was used as in the Dunk Probe test. In the AC Current run an AC current was applied with the Agilent 33120A 15 MHz Function / Arbitary Waveform Generator (GPIB 9). The signals from the Samples were filtered through a Low-Noise Preamplifier Stanford Research Systems Model SR560. The signal from the Waveform Generator along with the signal from the samples after passing through the preamplifier where both measured on the Tektronix TDS 3014 four channel color digital phosphor oscilloscope. Battery Powered Op Amp. filtering C1-1k Hz); 50 0hm Resistance; 1E3 train; low noise IR Dewar Pin 0ut IR Dewar AC Signal Generator 100 Hz Oscilloscope 1 M Ohm Resistance Oscilloscope Wire Resistance Op Amp. DUT
Plotted Data The following are graphs of the sample resistance versus the amount of current going through them. The graphs are essentially flat as can be seen when one zooms out. One can also notice that some graphs have a general trend to increase slightly as current is increased which can be explained by an increase in temperature du to an increase in current which would lead to an increase in resistance as phonon scattering is increased. Some of the graphs display a general trend down and even a sudden and sharp increase in resistance. These Are currently inexplicable and more data is required. Overall though the points vary at .0956 Ohms for the IR Dewar Test Ac current at 300K.
Although precautions where taken against the thermal electric effect by applying a AC voltage, one can notice that the average resistance for the DC measurement at 4K and the AC measurement at 4K are Identical. Average Resistance of Samples IR Dewar Test In Ohms • Sources of Error in the Experiment • IR Dewar Test • -In the AC Experiment the oscilloscope was used to get an accurate reading from the Signal generator and the sample • as opposed to a fluke meter this means that the scope was set up in parallel to the wire ring. The device functions property under the assumption that no current is diverted from the sample, but this of course is not an Ideal world and thus not the case • -The oscilloscope averages the inputs It receives, when not averaging the signal from the Sample was very fuzzy, meaning that there was a significant amount of noise from the sample reading; this is a source of error in the sense that the measurements an average of noise and data , not on absolute value • Dunk Test • -In the dunk test we were limited by the fluke meter which can only give so much of a precise answer. Especially when dealing with the low values at cryogenic temperatures • -We also did not account for the small changes in wire resistance when the wires cooled which in turn would affect our calculation of the amount of current going though the circuit. • -The thin films where deposited on silicon, when calculating the RRR we did not account for the silicon which is conductive to a small extent. Average Resistance of Aluminum Sample Dunk Probe Test in Ohms