
Obesity Trends Among U.S. Adults: 1985-2005
E N D
Presentation Transcript
Weight Management • Caloric needs • Vary by age, sex, height, weight, activity level, & basal metabolic rate (BMR) • Average (men = 2500 kcal, women = 2000 kcal) • Regular physical activity • Dietary guidelines • http://www.health.gov/dietaryguidelines/dga2005/document/
ENERGY IN ENERGY OUT BODY MASS GENES
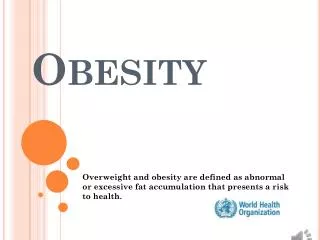
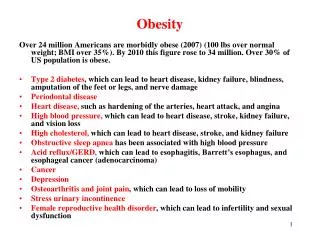
Obesity Trends Among U.S. Adults between 1985 and 2005 • Definitions: • Obesity: having a very high amount of body fat in relation to lean body mass, or Body Mass Index (BMI) of 30 or higher. • Body Mass Index (BMI): a measure of an adult’s weight in relation to his or her height, specifically the adult’s weight in kilograms divided by the square of his or her height in meters.
Obesity Trends Among U.S. Adults between 1985 and 2005 • Source of the data: • The data shown in these maps were collected through CDC’s Behavioral Risk Factor Surveillance System (BRFSS). Each year, state health departments use standard procedures to collect data through a series of monthly telephone interviews with U.S. adults. • Prevalence estimates generated for the maps may vary slightly from those generated for the states by BRFSS (http://aps.nccd.cdc.gov/brfss) as slightly different analytic methods are used.
During the past 20 years there has been a dramatic increase in obesity in the United States. In 1985, only a few states were participating in the CDC's Behavioral Risk Factor Surveillance System (BRFSS) and providing obesity data. In 1990, 4 states had obesity prevalence rates of 15–19 percent and no states had rates at or above 20 percent. • In 1995, obesity prevalence in each of the 50 states was less than 20 percent. In 2000, 28 states had obesity prevalence rates less than 20 percent. • In 2005, only 4 states had obesity prevalence rates less than 20 percent, while 17 states had prevalence rates equal to or greater than 25 percent, with 3 of those having prevalences equal to or greater than 30 percent (Louisiana, Mississippi, and West Virginia).
Obesity Trends* Among U.S. AdultsBRFSS,1990, 1995, 2005 (*BMI 30, or about 30 lbs overweight for 5’4” person) 1995 1990 2005 No Data <10% 10%–14% 15%–19% 20%–24% 25%–29% ≥30%
Obesity Trends* Among U.S. AdultsBRFSS, 1985 (*BMI ≥30, or ~ 30 lbs overweight for 5’ 4” person) No Data <10% 10%–14%
Obesity Trends* Among U.S. AdultsBRFSS, 1986 (*BMI ≥30, or ~ 30 lbs overweight for 5’ 4” person) No Data <10% 10%–14%
Obesity Trends* Among U.S. AdultsBRFSS, 1987 (*BMI ≥30, or ~ 30 lbs overweight for 5’ 4” person) No Data <10% 10%–14%
Obesity Trends* Among U.S. AdultsBRFSS, 1988 (*BMI ≥30, or ~ 30 lbs overweight for 5’ 4” person) No Data <10% 10%–14%
Obesity Trends* Among U.S. AdultsBRFSS, 1989 (*BMI ≥30, or ~ 30 lbs overweight for 5’ 4” person) No Data <10% 10%–14%
Obesity Trends* Among U.S. AdultsBRFSS, 1990 (*BMI ≥30, or ~ 30 lbs overweight for 5’ 4” person) No Data <10% 10%–14%
Obesity Trends* Among U.S. AdultsBRFSS, 1991 (*BMI ≥30, or ~ 30 lbs overweight for 5’ 4” person) No Data <10% 10%–14% 15%–19%
Obesity Trends* Among U.S. AdultsBRFSS, 1992 (*BMI ≥30, or ~ 30 lbs overweight for 5’ 4” person) No Data <10% 10%–14% 15%–19%
Obesity Trends* Among U.S. AdultsBRFSS, 1993 (*BMI ≥30, or ~ 30 lbs overweight for 5’ 4” person) No Data <10% 10%–14% 15%–19%
Obesity Trends* Among U.S. AdultsBRFSS, 1994 (*BMI ≥30, or ~ 30 lbs overweight for 5’ 4” person) No Data <10% 10%–14% 15%–19%
Obesity Trends* Among U.S. AdultsBRFSS, 1995 (*BMI ≥30, or ~ 30 lbs overweight for 5’ 4” person) No Data <10% 10%–14% 15%–19%
Obesity Trends* Among U.S. AdultsBRFSS, 1996 (*BMI ≥30, or ~ 30 lbs overweight for 5’ 4” person) No Data <10% 10%–14% 15%–19%
Obesity Trends* Among U.S. AdultsBRFSS, 1997 (*BMI ≥30, or ~ 30 lbs overweight for 5’ 4” person) No Data <10% 10%–14% 15%–19% ≥20%
Obesity Trends* Among U.S. AdultsBRFSS, 1998 (*BMI ≥30, or ~ 30 lbs overweight for 5’ 4” person) No Data <10% 10%–14% 15%–19% ≥20%
Obesity Trends* Among U.S. AdultsBRFSS, 1999 (*BMI ≥30, or ~ 30 lbs overweight for 5’ 4” person) No Data <10% 10%–14% 15%–19% ≥20%
Obesity Trends* Among U.S. AdultsBRFSS, 2000 (*BMI ≥30, or ~ 30 lbs overweight for 5’ 4” person) No Data <10% 10%–14% 15%–19% ≥20%
Obesity Trends* Among U.S. AdultsBRFSS, 2001 (*BMI ≥30, or ~ 30 lbs overweight for 5’ 4” person) No Data <10% 10%–14% 15%–19% 20%–24% ≥25%
Obesity Trends* Among U.S. AdultsBRFSS, 2002 (*BMI ≥30, or ~ 30 lbs overweight for 5’ 4” person) No Data <10% 10%–14% 15%–19% 20%–24% ≥25%
Obesity Trends* Among U.S. AdultsBRFSS, 2003 (*BMI ≥30, or ~ 30 lbs overweight for 5’ 4” person) No Data <10% 10%–14% 15%–19% 20%–24% ≥25%
Obesity Trends* Among U.S. AdultsBRFSS, 2004 (*BMI ≥30, or ~ 30 lbs overweight for 5’ 4” person) No Data <10% 10%–14% 15%–19% 20%–24% ≥25%
Obesity Trends* Among U.S. AdultsBRFSS, 2005 (*BMI ≥30, or ~ 30 lbs overweight for 5’ 4” person) No Data <10% 10%–14% 15%–19% 20%–24% 25%–29% ≥30%
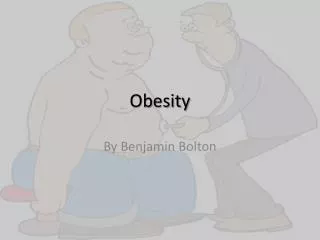
Obesity and health • Obesity (particularly “apple-pattern”) linked to atherosclerosis, hypertension, diabetes • Increased risk of several cancers, sleep disturbances, degenerative joint disease • Impact on psychological well-being • Increased mortality rates (next slide)
Factors That Contribute to Obesity • Heredity / Biological factors • Cultural factors • Emotional / behavioral factors
Hereditary factors • Genes contribute approximately 50 percent to the likelihood of obesity • 60 percent of obese people had obese biological parents • Body weights of adopted children correlate more strongly with weights of biological parents
A Fat Gene? • ob gene • Regulates production of leptin (hormone that suppresses appetite) • Mice born without the ability to make leptin eat without restraint
ob/ob mouse normal mice
ob/ob mouse ob/ob mouse injected with leptin
So, just give obese humans leptin!!! • In fact, this works in leptin-deficient humans, but… • 99.99% of obese humans have HIGH levels of leptin, but have become insensitive to it.
10,000 years ago – who survived during a famine?
ENERGY IN ENERGY OUT Increase in availability of high density foods (sugar/fat are cheap) Increase in size Decrease in cost Decrease in work- related activities Decrease in activity of daily living BODY MASS Genetic predisposition to store fat
Just as our jeans no longer fit our waist, our genes no longer fit our environment
Social/Cultural Factors in Obesity • Food-toxic environment (cheap, hi-cal, lo-quality food available) • absence of supermarkets in lo-income neighborhoods • 30% of our calories are coming from junk food • Governmental contribution (ABC News video) • We are simply eating more! (next slide)
Humongasize it!! 1955 Today French Fries 2.3 oz 6.7 oz Soda 6.5 oz 20.0 oz Snickers bar 1.1 oz 3.7 oz
POPCORN 20 Years Ago Today 630 calories11 cups 270 calories 5 cups
Social/Cultural Factors in Obesity • Pounds consumed per person • 1970 – 1,497 lbs. • 2000 – 1,775 lbs. • 2004: The "Monster Thickburger" — two 1/3-pound slabs of Angus beef, four strips of bacon, three slices of cheese and mayonnaise on a buttered sesame seed bun • 1420 calories! • Other examples from Aug 04 (Nat’l Geo)
Social/Cultural Factors in Obesity • Cultural variation in ideal body image (overemphasis on thinness yo-yo dieting and eventual weight gain) • African-American women less preoccupied with thinness than European-Americans • Japanese-American men are 3 times as likely to be obese as men living in Japan
Emotional / Behavioral factors • Disinhibition— overeating triggered by an event, emotion, or behavior • Eating used as coping • Internality / Externality hypothesis • Sensitivity to cues • Overweight people often more sensitive to external: • Time of day • Commercials • “Golden arches”
Dieting concerns • Dieting • In U.S., 72% of women and 44% of men have dieted at some point in their adult lives • Yo-yo dieting associated with progressive wt gain • Chronic dieting influence BMR negatively • Fad diets and health problems
Healthy Weight Loss • Assessment • Food diary • Activity • Beliefs (re: dieting, eating) • Nutritional knowledge • Stress levels
Healthy Weight Loss • Cognitive-behavioral program • Goal-setting, monitoring, social support • L.E.A.N. • Lifestyle changes (stimulus control, self-monitoring, speed, etc.) • Exercise • Attitude • Nutrition