Download
1 / 13
130 likes | 236 Vues
Explore the key aspects of the Butte Creek modeling project, including length, structures, flow rate, elevation, and model deliverable files. Get insights into model construction, significant elements, development issues, QC process, calibration, and review of results.

E N D
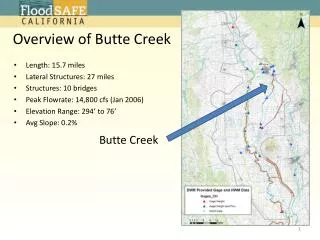
Overview of Butte Creek Butte Creek • Length: 15.7 miles • Lateral Structures: 27 miles • Structures: 10 bridges • Peak Flowrate: 14,800 cfs (Jan 2006) • Elevation Range: 294’ to 76’ • Avg Slope: 0.2%
Model Deliverable Files • Documentation Form • QC Form and Responses • Bridge Data Forms • Selected GIS Files • HEC-RAS Files • Bridge Photos
Summary of Model Construction • Cross Sections • Bathymetry Data • Manning’s n • Chow and ground cover from aerial • 0.025 “bare” ground • 0.030 crops • 0.035 channel “common features” • 0.050 “heavy” natural vegetation • Bridge Structures • Lateral Weirs
Summary of Model Construction – cont. • HEC-GEO RAS to build HEC-RAS elements
Summary of Model Construction – cont. • Boundary Conditions • US Flow Hydrograph • DS Normal Depth • Flow Data • Corrected Flows from MBK
Significant Model Elements • Bridge at 30.526 • Rebuilt after aerial image • Skewed • Long span • Lateral Weirs
Significant Model Elements • Bridge at 36.883 • Multiple Bridge • Highway and Railroad
Major Model Development Issues • Invert verification • lateral weir / bridge interaction • ineffective flow definitions
Summary of QC Process • Internal Team, internal pass to the right, Independent and Atkins/DWR. • documentation/additions within HEC-RAS, QC form, HEC-RAS model changes and adjustments
Summary of Calibration • Matched WSE at Gage location within 1.0’ • Adjusted Manning’s n • Refined/simplified ineffective flow areas • HHCWG weir coefficients • Modeling approach at bridge openings
Review of Results • Max WSE • Lateral Structures • Observed HWM • Bridge Structures • Side Tributary